In the hyper-saturated digital landscape of 2026, the traditional "vanity metrics" of the past decade—primarily follower counts and total likes—have been relegated to the sidelines of serious marketing discourse. Replacing them is a more nuanced, rigorous standard: the engagement rate. As social media algorithms become increasingly sophisticated, prioritizing "meaningful social interactions" over passive scrolling, understanding the mechanics of engagement has become the primary differentiator between brands that thrive and those that merely exist.
A recent extensive study conducted by Hootsuite in partnership with the data science agency Critical Truth analyzed over one million social posts across various industries. The findings provide a definitive roadmap for digital strategists, revealing that engagement is no longer just a measure of popularity, but a critical indicator of brand health, algorithmic visibility, and return on investment (ROI).
Main Facts: Defining Engagement in the Modern Era
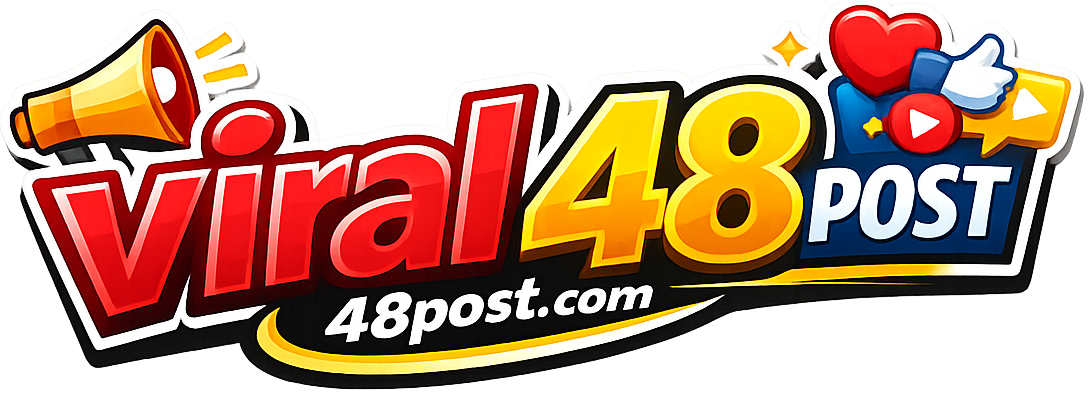
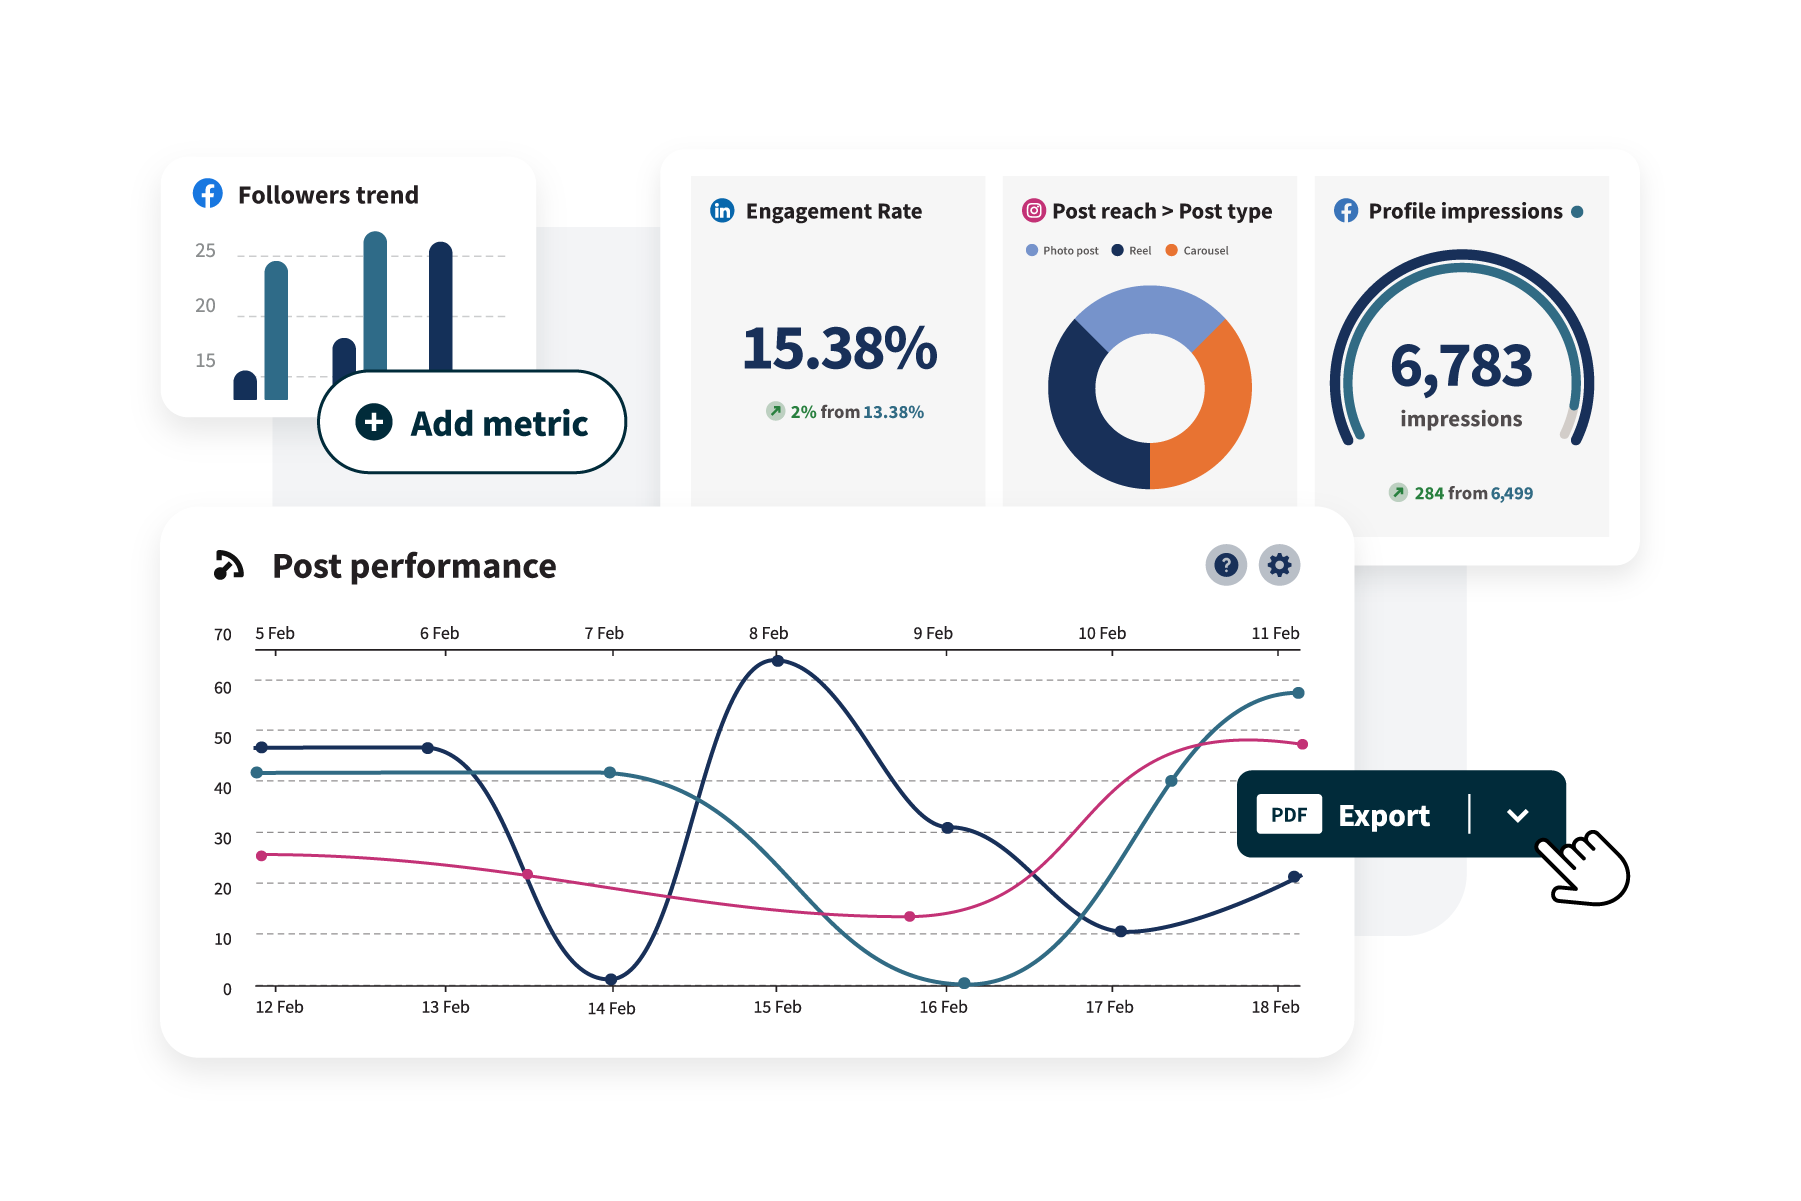
At its core, the engagement rate is a social media metric that quantifies the level of active interaction an audience has with a piece of content, a campaign, or an entire account. Unlike impressions, which measure how many times content was displayed, engagement measures what people did with that content.
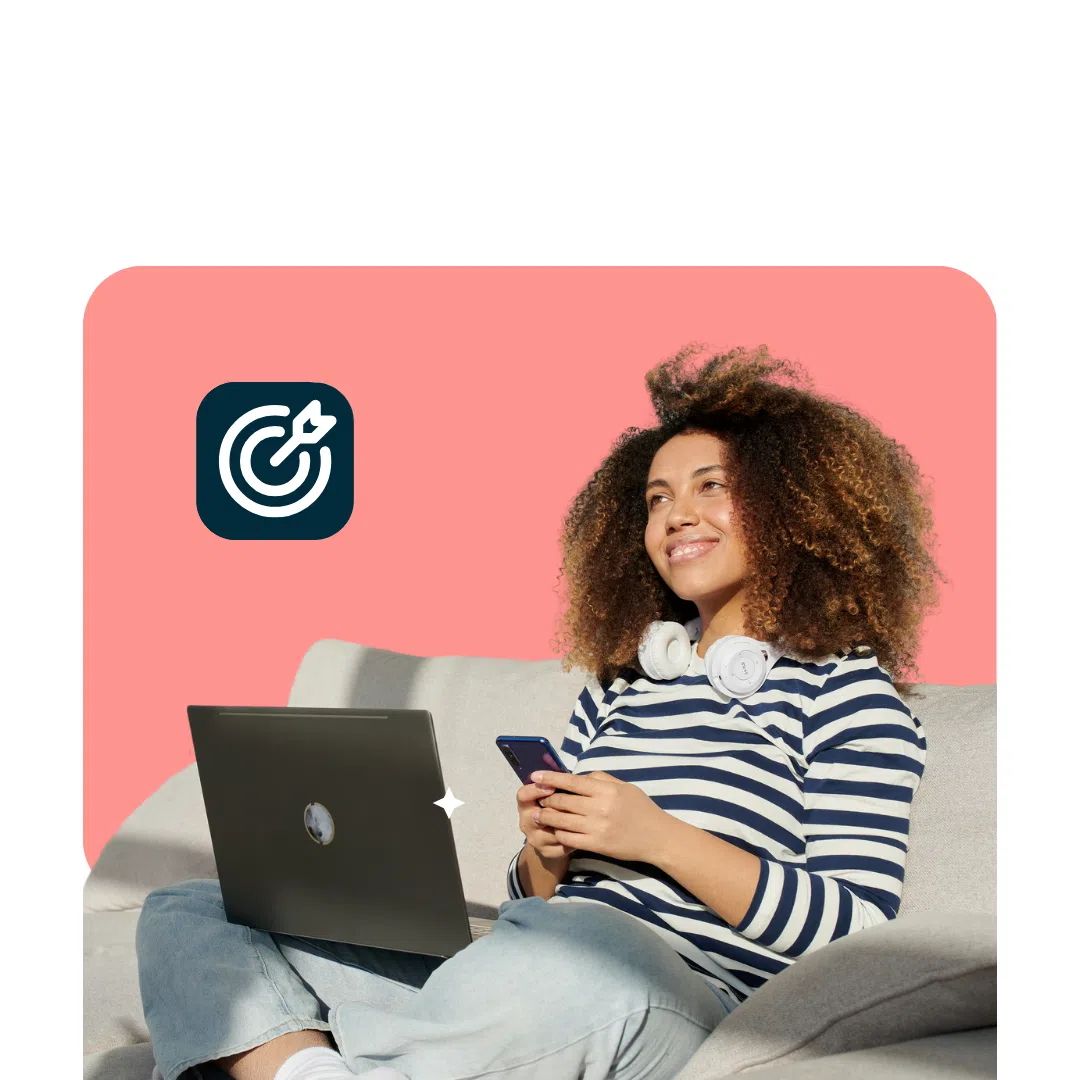
The definition of "interaction" has expanded significantly. In 2026, engagement encompasses a diverse array of actions:

- Active Interactions: Comments, shares, reposts, and direct messages.
- Intent-Based Actions: Saves, link clicks, and poll responses.
- Platform-Specific Metrics: Reels remixes, TikTok "Stitches," and LinkedIn "Funny" or "Insightful" reactions.
Because each platform—from the visual-centric Instagram to the professional-heavy LinkedIn—utilizes a unique algorithm, the weight of these actions varies. However, the fundamental principle remains: higher engagement signals to the platform that the content is valuable, which in turn triggers the algorithm to surface that content to a broader, often non-following audience.
Chronology: The Evolution of Social Media Success Metrics
To understand why engagement rate is the gold standard today, one must look at the chronological shift in digital marketing priorities over the last two decades.
- The Era of Reach (2004–2012): In the early days of Facebook and Twitter, success was measured by the size of the "broadcast." Brands focused on accumulating followers, assuming that every follower would see every post in a chronological feed.
- The Era of the Like (2013–2019): As feeds became algorithmic, the "Like" became the primary currency. However, marketers soon realized that a "Like" was a low-effort interaction that didn’t necessarily correlate with brand loyalty or sales.
- The Era of Meaningful Interaction (2020–2024): Platforms began deprioritizing passive consumption. Instagram experimented with hiding like counts, and TikTok’s "For You Page" proved that content quality could outweigh follower count.
- The Era of Algorithmic Resonance (2025–Present): Today, the focus is on the "depth" of engagement. Algorithms now prioritize content that sparks conversation or provides utility (saves). Engagement rate is the mathematical expression of this resonance.
Supporting Data: The Six Essential Formulas
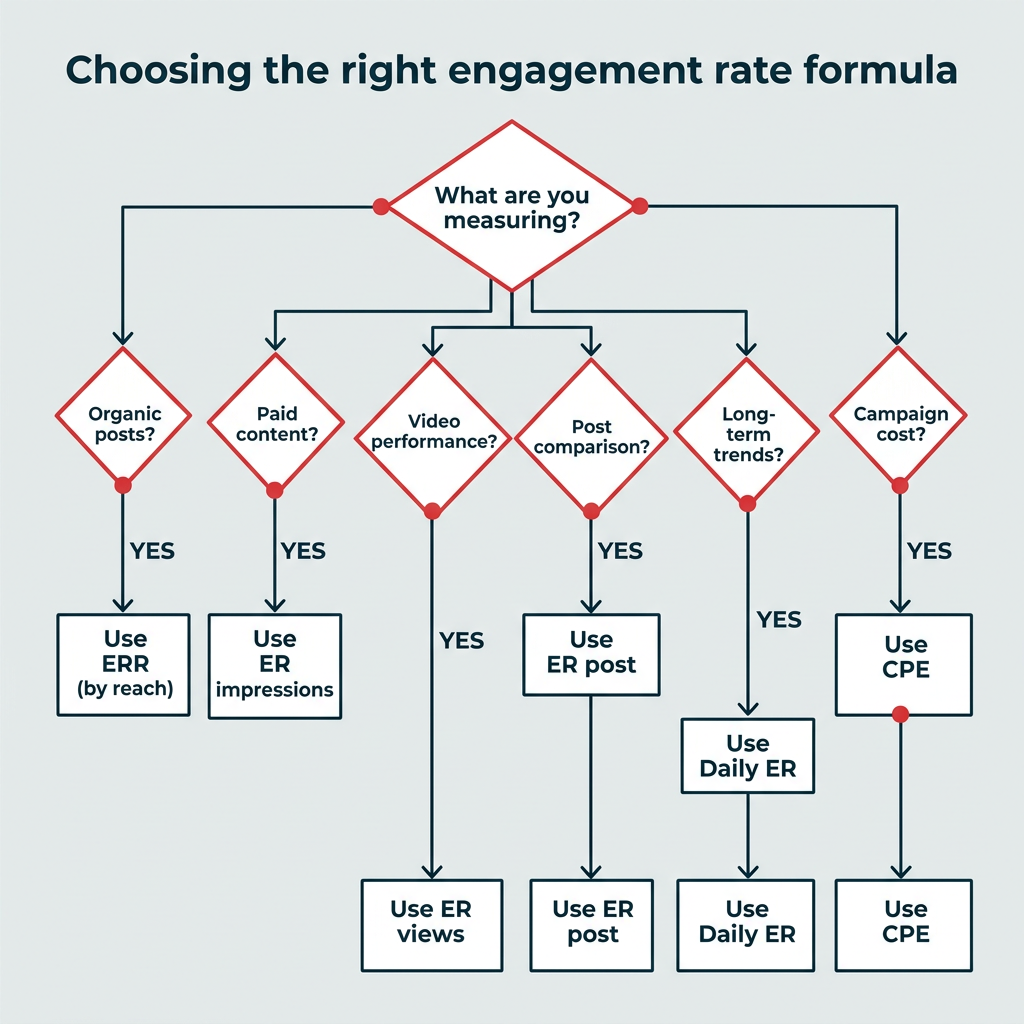
To accurately measure success, enterprise teams now utilize six distinct formulas, each serving a specific strategic purpose.
1. Engagement Rate by Reach (ERR)
Formula: (Total Engagements / Reach) * 100
This is considered the most accurate measure for organic content. It calculates the percentage of people who interacted with a post after seeing it. Unlike follower-based metrics, ERR accounts for viral reach, including users who do not follow the account but saw the post via discovery tools.

2. Engagement Rate by Post (ER Post)
Formula: (Total Engagements on a Post / Total Followers) * 100
Often used by influencers, this formula provides a stable baseline. It is best for comparing the performance of specific content types against a fixed audience size.
3. Engagement Rate by Impressions (ER Impressions)
Formula: (Total Engagements / Total Impressions) * 100
Critical for paid media, this measures how many interactions occur relative to every screen appearance. It is the primary metric for evaluating the efficiency of CPM-based (Cost Per Mille) ad campaigns.
4. Daily Engagement Rate (Daily ER)
Formula: (Total Engagements in 24 Hours / Total Followers) * 100
This offers a long-term view of account health. It captures interactions on all content, including "evergreen" posts from previous months that a new follower might be discovering.
5. Engagement Rate by Views (ER Views)
Formula: (Total Engagements / Total Video Views) * 100
With the dominance of short-form video (Reels, TikToks), this formula measures the "stickiness" of video content.
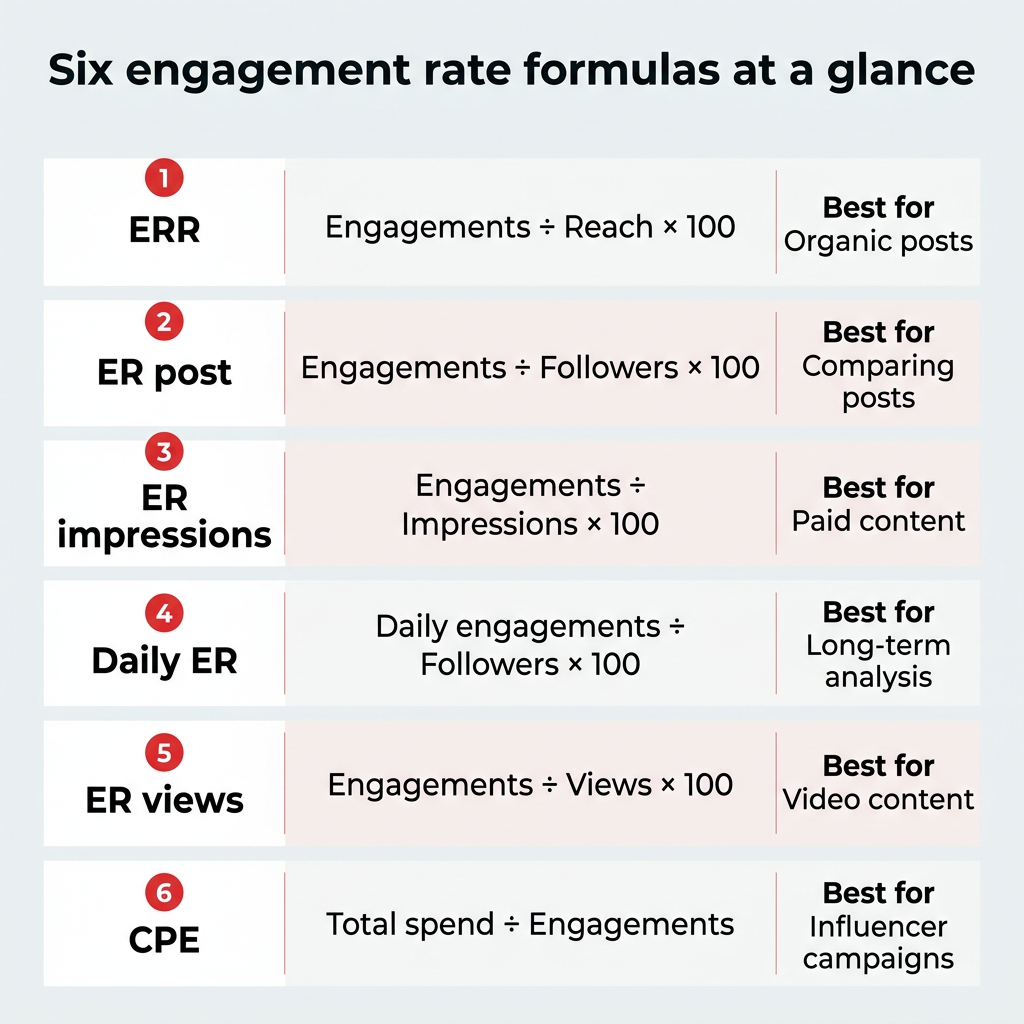
6. Cost Per Engagement (CPE)
Formula: Total Amount Spent / Total Engagements
For performance marketers, CPE is the ultimate efficiency metric, determining the literal dollar value of every comment, share, and click.
Official Benchmarks: The 2026 Industry Standard
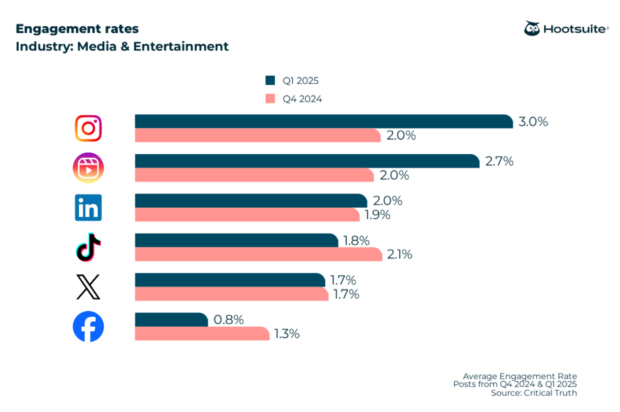
The Hootsuite/Critical Truth 2026 report establishes clear benchmarks for what constitutes a "good" engagement rate. While the general average across all industries hovers between 1% and 5%, the data reveals significant variance by platform and sector.
Platform-Specific Averages (All Industries)
- Instagram: 3.0%
- Instagram Reels: 2.7%
- LinkedIn: 2.0%
- X (formerly Twitter): 1.8%
- TikTok: 1.5%
- Facebook: 0.8%
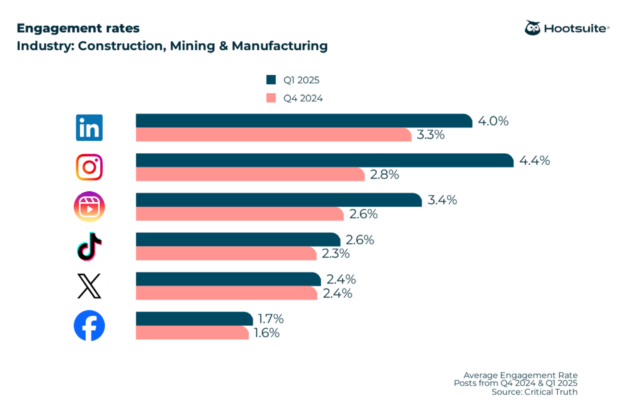
Industry-Specific Deep Dives
The data indicates that niche-specific audiences interact with content at vastly different rates:
- Construction & Manufacturing: Leads on Instagram with a 4.4% engagement rate, as visual updates on large-scale projects drive high interest.
- Finance: Shows surprising strength on Instagram at 3.8%, driven by educational carousels and "fin-tok" style advice.
- Consumer Goods & Retail: Dominates LinkedIn with a 3.9% rate, where B2B networking and corporate social responsibility (CSR) updates perform best.
- Nonprofits: Maintain a high emotional resonance on Instagram at 4.4%, leveraging storytelling to drive shares and saves.
Expert Perspectives and Official Responses
Industry analysts suggest that the lower engagement rate on TikTok (1.5%) compared to Instagram (3.0%) is not necessarily a sign of weakness, but a difference in user behavior. "TikTok is a high-volume, discovery-first platform," says Christina Newberry, a veteran digital marketing researcher. "Users may view a hundred videos in a sitting but only engage with a few. On Instagram, the interaction is more intentional and community-focused."
Enterprise leadership teams are increasingly using these benchmarks to justify social media spend. By shifting the conversation from "how many followers do we have?" to "how efficiently are we engaging our reach?", social media managers are able to prove a direct link between content quality and brand affinity.
Implications: The Future of Social Strategy
The transition to engagement-led strategy has profound implications for how brands must operate in the coming years.

1. The Death of the "Broadcast" Model
Brands can no longer treat social media as a one-way channel for press releases. The 2026 data shows that accounts that respond to comments and participate in the "social" aspect of social media see a 25-40% increase in their overall engagement rate. Community management is now a core pillar of content performance.
2. Quality Over Quantity
The algorithms of 2026 are designed to punish "engagement bait" (e.g., "Like if you agree"). Instead, they reward content that provides genuine utility. The rise of "Saves" as a primary metric on Instagram and TikTok indicates that users value content they can return to—recipes, tutorials, and deep-dive industry insights.
3. The "Prime Time" Window
Timing remains critical. Data indicates that posting when the audience is most active doesn’t just increase immediate likes; it provides the "initial velocity" needed for the algorithm to categorize the post as "high quality," leading to sustained reach over 48 to 72 hours.
4. Format Experimentation
The benchmarks reveal that carousels and short-form videos (Reels/TikToks) consistently outperform static images. For brands in the real estate or professional services sectors, moving toward video-first storytelling is no longer optional—it is a requirement for maintaining an engagement rate above the 1% threshold.
Conclusion
As we move further into 2026, the engagement rate stands as the most honest reflection of a brand’s social media impact. It is a metric that cannot be easily gamed by bots or inflated by passive follower counts. For the modern marketer, the mandate is clear: move beyond the "view" and focus on the "interaction." By utilizing the correct formulas, benchmarking against industry peers, and fostering a genuine community, brands can turn social media from a cost center into a powerful engine for growth and engagement.
