
 By Basiran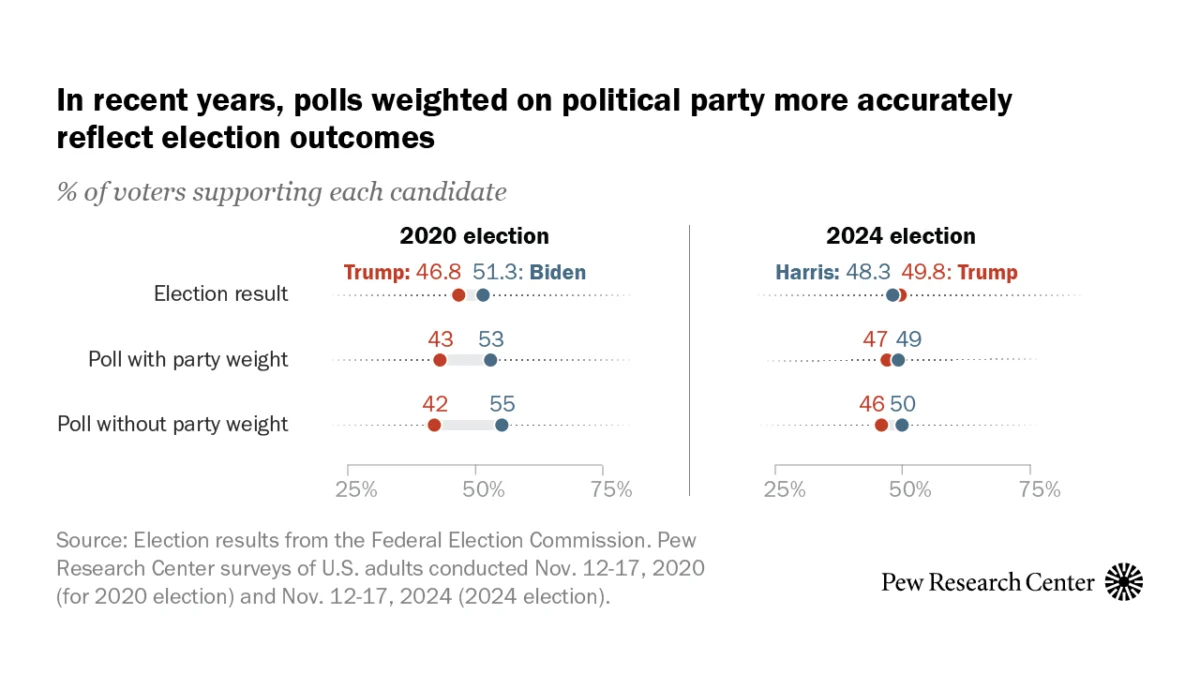
WASHINGTON — In an era defined by razor-thin electoral margins, political polling has entered a period of profound introspection. For decades, survey researchers operated under the assumption that drawing a random sample of the American public, asking them for their political views, and aggregating the results would yield an accurate picture of the electorate.
Today, that foundational premise is under siege.
Driven by plummeting response rates, shifting social norms, and persistent partisan skews, modern pollsters are increasingly adopting a controversial yet necessary mathematical correction known as political weighting. Rather than letting raw survey samples speak entirely for themselves, pollsters are actively adjusting their data to reflect the true political composition of the United States.
A comprehensive report recently released by the Pew Research Center sheds light on why this practice has transformed from a niche methodological adjustment into an industry-standard necessity. According to the research, pollsters rely on political weighting—adjusting surveys based on party affiliation and past voting behavior—to combat two critical threats: a systematic bias favoring Democrats that emerged around 2016, and wild poll-to-poll volatility driven by shifting participation rates rather than actual changes in public opinion.
Main Facts: The Crisis of Representation
To understand why political weighting has become indispensable, one must first understand the crisis facing modern survey research. The primary obstacle is not a lack of statistical sophistication, but a stark, long-term decline in human cooperation.
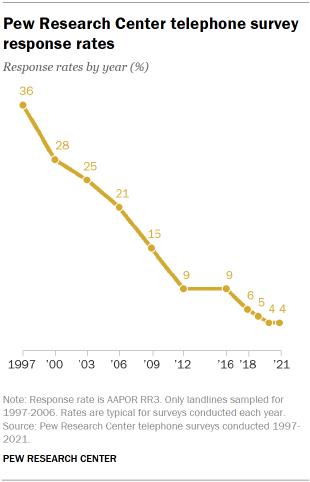
Getting everyday citizens to answer a phone call, open an email, or complete an online questionnaire has become remarkably difficult. Consequently, response rates have plummeted from double digits to fractions of a percent. For instance, telephone survey response rates at the Pew Research Center tumbled from 36% in 1997 to the low single digits in recent years. In 2022, a high-profile New York Times/Siena telephone poll reported a response rate of just 0.4%. Online panels face similar headwinds; Pew’s own esteemed American Trends Panel yields an aggregate response rate of roughly 3% when accounting for recruitment, initial invitations, and wave-to-wave attrition.
When 97% or more of the people selected for a survey choose not to participate, the door is kicked wide open for nonresponse bias. If the people who choose to answer polls differ systematically from those who hang up or ignore the prompt, the raw data will be fundamentally skewed. In contemporary American politics, this manifests as partisan nonresponse bias—the growing tendency for Republicans to be slightly less likely than Democrats to participate in political surveys.
Chronology: A History of Polling Accuracy and Error
To appreciate the gravity of recent polling errors, researchers look back at a rich historical timeline of pre-election polling, marked by periods of remarkable precision interspersed with historic failures.
The Early Shocks (1948–1980)
Well-designed polls historically enjoyed a strong track record of matching actual election outcomes. However, the industry has weathered spectacular failures that left permanent scars on its public reputation. In 1948, polls famously predicted that Republican Thomas Dewey would easily defeat President Harry Truman, missing the historic upset. In 1980, final pre-election polls suggested a tight race between incumbent President Jimmy Carter and challenger Ronald Reagan; instead, Reagan cruised to a nearly 10-percentage-point victory.
The Golden Era of Stability (2000–2012)
Following the 1980 miscalculation, polling methodology underwent a renaissance. Pre-election polls leading up to the 2000, 2004, 2008, and 2012 presidential elections were remarkably accurate. While the 2000 and 2012 cycles featured slightly larger errors that marginally overstated support for Republican candidates, the overall landscape was characterized by small, bidirectional errors.
The Turning Point: 2016 and the Trump Era
The era of reliable, routine accuracy fractured in 2016. Donald Trump’s victory over Hillary Clinton shocked political analysts, as national polls slightly overstated Clinton’s vote share, and state-level polls in critical battleground states missed the mark by significant margins.
The situation deteriorated further in 2020. A post-election evaluation by the American Association for Public Opinion Research (AAPOR) delivered a sobering verdict: "The 2020 polls featured polling error of an unusual magnitude: It was the highest in 40 years for the national popular vote and the highest in at least 20 years for state-level estimates of the vote in presidential, senatorial, and gubernatorial contests." Once again, the errors systematically underestimated Republican support.
The 2024 Correction
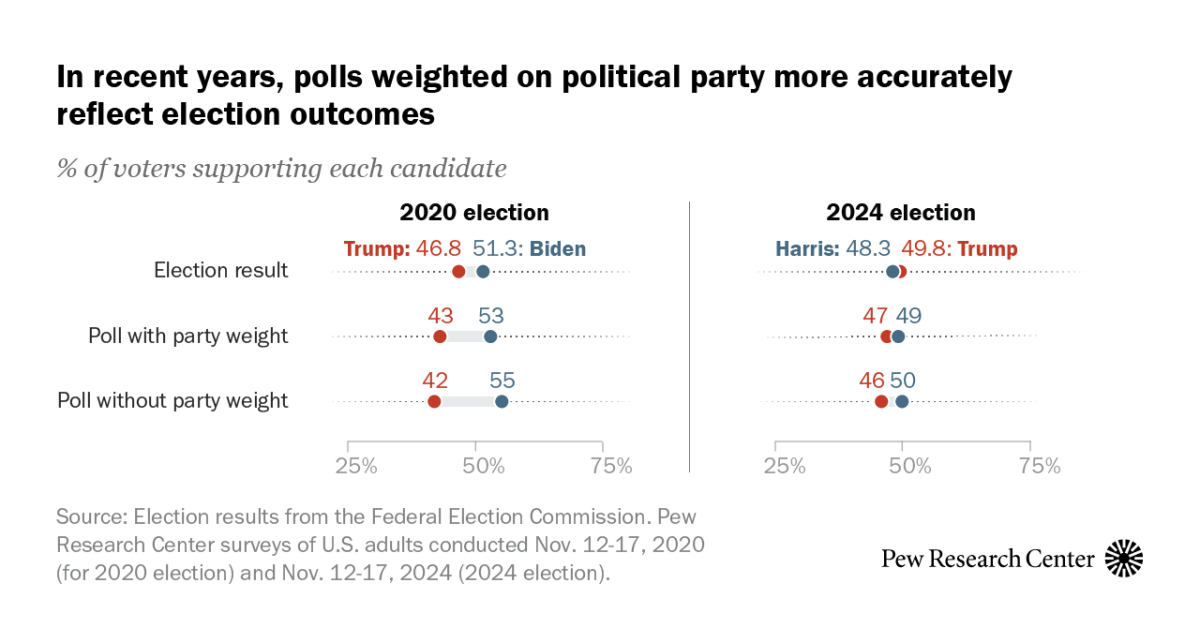
Entering the 2024 presidential election, a significantly larger cohort of pollsters adjusted their methodologies, explicitly weighting their samples on party affiliation or recalled past votes. While 2024 polls still exhibited errors running in the same direction—underestimating Donald Trump’s support for the third consecutive presidential cycle—the absolute magnitude of those errors was noticeably smaller than in 2020.
Supporting Data: Why "Noisy" Polls Demand Mathematical Intervention
Beyond systematic partisan bias, pollsters face another major headache: erratic, bouncing poll numbers that seem to defy logic.
Phone-based and online trackers have long observed that party affiliation metrics and candidate support figures fluctuate wildly over time. While some of these shifts align with major campaign events—such as the traditional "convention bounce" following a party’s nominating conference, or high-profile stumbles like President Barack Obama’s rocky first debate against Mitt Romney in 2012, or the 2016 Access Hollywood tape release—many of these movements are illusory.
Political scientists have long argued that these sudden shifts do not represent genuine, mass conversions of voter loyalty. Instead, they reflect temporary fluctuations in enthusiasm. When a candidate suffers a bad news cycle, their most ardent supporters may temporarily grow disillusioned and decline to answer pollsters’ calls. Conversely, a triumphant convention can temporarily spur partisans to action.
Panel data tracking individual respondents over time reveals a clear link: high-profile campaign events directly influence whether specific partisans choose to pick up the phone. In an era of ultra-low response rates, these fluctuating participation rates create artificial volatility in top-line poll numbers.
By applying political weighting—anchoring a survey’s baseline party ID and past vote totals to reliable benchmarks—pollsters can effectively filter out this noise. This ensures that the relative shares of Republicans and Democrats remain stable and representative, rather than hyper-reactive to the news cycle of a given week.
Official Responses and Expert Consensus
The pivot toward aggressive political weighting has generated robust debate within the data science and polling communities. Professional organizations, including AAPOR and independent academic task forces, have extensively scrutinized the practice.
While traditional purists once argued that weighting a survey on political metrics was akin to "putting your thumb on the scale" or baking assumptions into the data, the overwhelming consensus has shifted. Experts now view weighting not as an arbitrary manipulation, but as an essential corrective measure against undeniable demographic and behavioral skews.
"In a closely divided country where elections have been decided by razor-thin margins, errors of even a few percentage points are highly consequential," notes methodology literature from the Pew Research Center. "Careful weighting on political outcomes tends to help. It reduces the overrepresentation of Democrats, increases the estimated share of Republicans, and in turn increases polling accuracy compared with election outcomes."
However, methodologists are quick to caution that weighting is not a silver bullet. It introduces its own set of challenges, including the risk of amplifying sampling variance if the external benchmarks used for weighting are flawed or outdated. Researchers must carefully balance the variables they choose to adjust, weighing the benefits of partisan correction against potential blind spots.
Implications: The Future of Public Opinion Research
As the United States prepares for future election cycles, the implications of these methodological shifts extend far beyond academic journals and newsrooms.
First, political polling must continue to evolve. As traditional telephony becomes virtually obsolete as a reliable sampling frame, pollsters are leaning into multi-mode designs, address-based sampling, and longitudinal panels. But no matter how advanced the data collection method becomes, the underlying psychological reality of nonresponse remains: citizens are increasingly weary, skeptical, or simply too busy to engage with surveys.
Second, media consumers, political campaigns, and everyday voters must become more literate consumers of polling data. Understanding that a poll is not a passive mirror of society, but a carefully calibrated statistical model, changes how one interprets a shifting lead or a tight race.
Ultimately, political weighting is a testament to the resilience of survey researchers. Faced with collapsing response rates and unprecedented partisan headwinds, the polling industry has chosen adaptation over obsolescence. By acknowledging systemic biases and engineering sophisticated mathematical safeguards, modern pollsters are striving to ensure that public opinion research remains a reliable window into the American democratic experiment.
 Suro Senen
  Reynand Wu