
 By Jia Lissa
In an era defined by shifting political landscapes, evolving media habits, and changing patterns of civic participation, understanding how Americans engage with their communities and their government has never been more critical. To gain a comprehensive understanding of these behaviors, the Pew Research Center, in partnership with SSRS, conducted the 2025 Cross-Sectional Engagement Survey and integrated its findings with Wave 179 of the American Trends Panel (ATP).
This methodological report details the rigorous scientific processes employed to ensure that these findings accurately represent the diverse voices of the United States. By combining address-based sampling, multimode data collection, and advanced cluster analysis, researchers have created a definitive map of American engagement in the mid-2020s.
The 2025 Cross-Sectional Engagement Survey: Main Facts and Methodology
The primary objective of the 2025 Cross-Sectional Engagement Survey was to capture a high-fidelity snapshot of public life. Fielded from July 9 to December 5, 2025, the study achieved a total sample size of 5,393 respondents.

Multimode Data Collection
To maximize accessibility and inclusivity, the research team utilized a multimode protocol. Participants were initially contacted via mail and invited to complete the survey online. To capture those less comfortable with digital interfaces or those lacking reliable internet access, the team employed a sequential design:
- Online: 2,705 respondents.
- Paper: 2,500 respondents.
- Telephone: 188 respondents (facilitated via a toll-free number provided in the initial mailings).
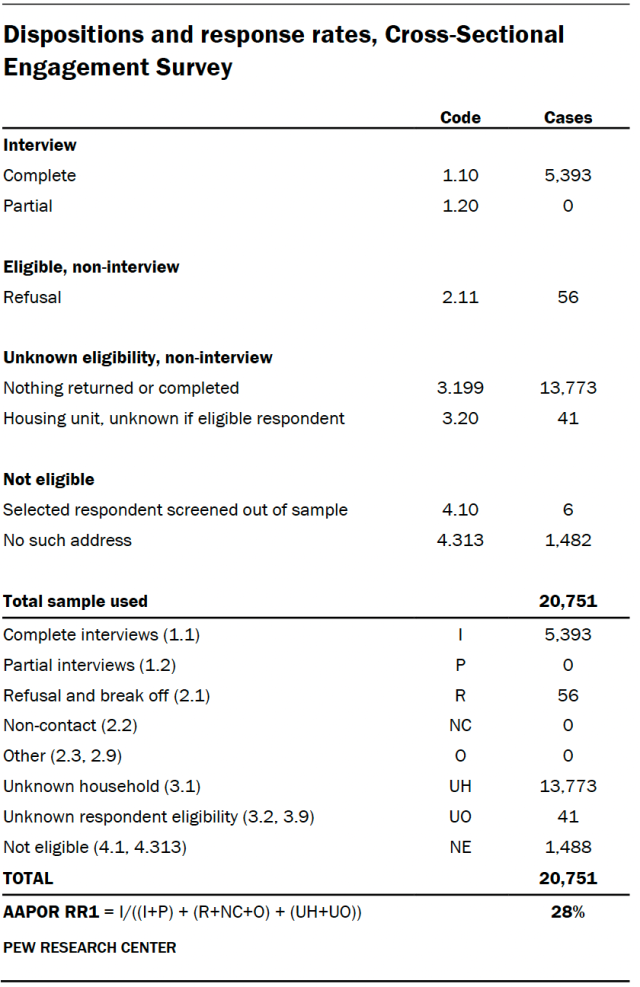
The survey was administered in both English and Spanish to ensure representative coverage of the Hispanic population. The AAPOR Response Rate 1 was recorded at 28%, a robust figure in the current landscape of survey research.
Sample Definition and Mailing Protocol
The sample was drawn from the U.S. Postal Service’s Computerized Delivery Sequence File, provided by the Marketing Systems Group (MSG). The selection process utilized a stratified random sample, ensuring that occupied residential addresses—including "drop points"—across all 50 states and the District of Columbia had a nonzero chance of inclusion.
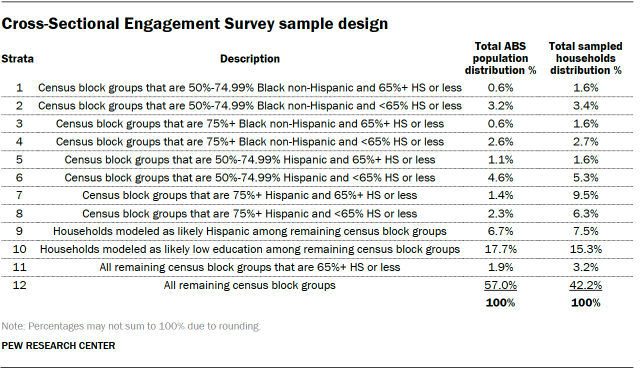
The mailing protocol was designed to be both engaging and experimental. Households received 9-by-12-inch window envelopes containing a $1 bill—a strategy used to increase participation rates. Two embedded experiments were conducted: one testing the impact of QR codes on response rates and another comparing the efficacy of a single $1 bill versus two $1 bills as an incentive. For non-responders, the process escalated to Priority Mail envelopes containing a $5 bill and a physical paper survey, further demonstrating the commitment to achieving a high-quality, diverse dataset.
The American Trends Panel (ATP) Wave 179
While the Cross-Sectional Survey provided the baseline for behavior, the American Trends Panel (ATP) Wave 179 allowed researchers to cross-reference these behaviors with deep-seated political attitudes and knowledge.
Overview of ATP Wave 179
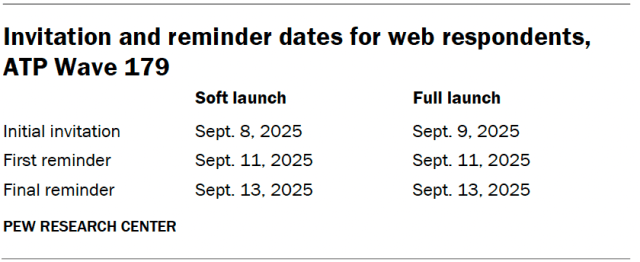
Conducted between September 8 and September 14, 2025, the ATP survey included 5,195 respondents from a sample of 5,852, resulting in an impressive 89% response rate. This panel consists of a nationally representative group of randomly selected U.S. adults. To ensure specific demographics were accurately captured, the study oversampled non-Hispanic Asian adults, a group traditionally harder to reach in smaller samples.
The ATP methodology relies on long-term engagement; since 2018, the panel has utilized address-based sampling (ABS) to maintain a representative pool. By utilizing this longitudinal panel, the research team was able to project engagement clusters—developed in the larger cross-sectional survey—onto the ATP dataset to observe how specific engagement patterns correlate with trust in news, feelings about the country, and civic knowledge.
Statistical Rigor: Weighting and Data Quality
Any survey of this magnitude requires significant statistical adjustment to ensure that the results reflect the actual U.S. adult population.
The Weighting Process
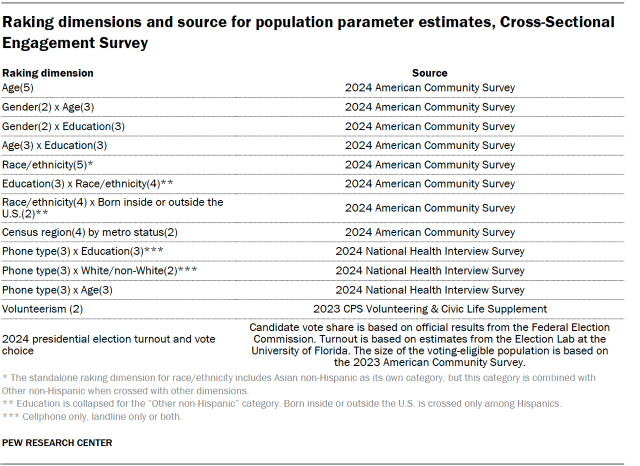
Both studies employed a multistep weighting process. The base weight accounts for the probability of selection from the USPS delivery file and the number of adults within each household. This is followed by a raking calibration—or iterative proportional fitting—which aligns the sample with demographic benchmarks from the U.S. Census Bureau.

The process specifically incorporates an "adaptive mode adjustment" for those who responded via offline methods (paper or phone), ensuring that the medium of response does not introduce bias into the findings. To protect against the influence of outliers, weights were trimmed at the 1st and 99th percentiles, ensuring that no single respondent disproportionately influences the final results.
Design Effects and Margins of Error
The complexity of these sampling designs—specifically the use of stratification and weighting—increases the variance of survey estimates. This is accounted for through the "design effect" (deff). For the Cross-Sectional Engagement Survey, the margin of error for full-sample estimates at 50% is ±1.9 percentage points. For the ATP Wave 179, the margin of error is ±1.6 percentage points. These figures underscore the high level of confidence researchers have in the reported data, while also acknowledging that other factors, such as question wording and reporting inaccuracy, remain inherent risks in any public opinion research.
Engagement Group Creation: The Cluster Analysis
One of the most innovative aspects of the 2025 research is the categorization of Americans into four distinct "engagement groups." This classification was not based on demographic labels, but rather on behavioral patterns.
The 19-Question Framework
Researchers identified 19 key behaviors across politics, religion, news consumption, and civic participation. These included:
- Volunteering and organizational membership.
- Attendance at local government meetings.
- Depth of engagement with national and local news.
- Frequency of political discussions.
- Digital civic activity (liking, sharing, or posting news online).
- Financial contributions to political or charitable causes.
- Participation in demonstrations or contacting elected officials.
- Voting history in the 2024 presidential election.
The Methodology of Clustering
To organize these behaviors, researchers used "weighted clustering around medoids" (k-medoids). This statistical technique identifies respondents with similar behavioral "fingerprints" and groups them accordingly. Unlike traditional models that might rely on arbitrary thresholds, this approach used Gower’s distance, which allows for the analysis of mixed data types (binary vs. scaled) without requiring variable standardization.
The researchers performed extensive data cleaning, excluding 13 respondents who failed to answer nine or more of the 19 core questions. By choosing a solution that provided cohesive, distinct, and substantively meaningful groups, the team ensured that the final typology could be used as a practical tool for understanding the American public’s civic life.
Implications for Future Research
The integration of the Cross-Sectional Engagement Survey with the ATP Wave 179 provides a unique look into the intersection of action and attitude. By projecting the engagement clusters onto the ATP, researchers were able to infer how different "types" of citizens perceive news organizations and political trust, even when those specific questions were not asked in the primary behavioral survey.
Addressing Potential Bias
The research team took significant steps to mitigate potential biases:
- Data Quality Checks: For the ATP, researchers removed respondents who showed signs of "satisficing"—the tendency to provide superficial or patterned answers (e.g., selecting the first option for every question).
- Robustness Testing: The cluster analysis models were run multiple times with different starting conditions to ensure the resulting groups were not a product of the order in which data was entered.
- Transparency: All methodological decisions, including the choice of algorithm and the handling of item nonresponse, have been documented to allow for peer review and replication.
Conclusion
The 2025 engagement research project stands as a benchmark for modern survey methodology. By successfully navigating the complexities of address-based sampling, the challenges of multimode data collection, and the technical rigor of cluster analysis, the Pew Research Center has provided a vital tool for sociologists, political scientists, and the general public. As America continues to navigate the complexities of a digital and polarized age, this study offers a clear, data-driven window into the heartbeat of the nation’s civic life.
 Pevita Pearce
  Neng Nana