As the digital marketing landscape continues to evolve, understanding and interpreting platform-specific performance data remains a critical pillar for brand growth, community engagement, and return on investment (ROI). For social media managers and enterprise leaders navigating X (formerlyTwitter), the rules of engagement—and the accessibility of analytics tools—have shifted significantly.
With native deep-dive reporting largely restricted behind the platform’s X Premium paywall, digital marketers must strategically adapt. This comprehensive breakdown explores the current state of X analytics, how to access valuable metrics across free and paid environments, which Key Performance Indicators (KPIs) matter most, and how tools like Hootsuite and Perch are redefining multi-channel social intelligence.
Main Facts: The Current State of X Analytics
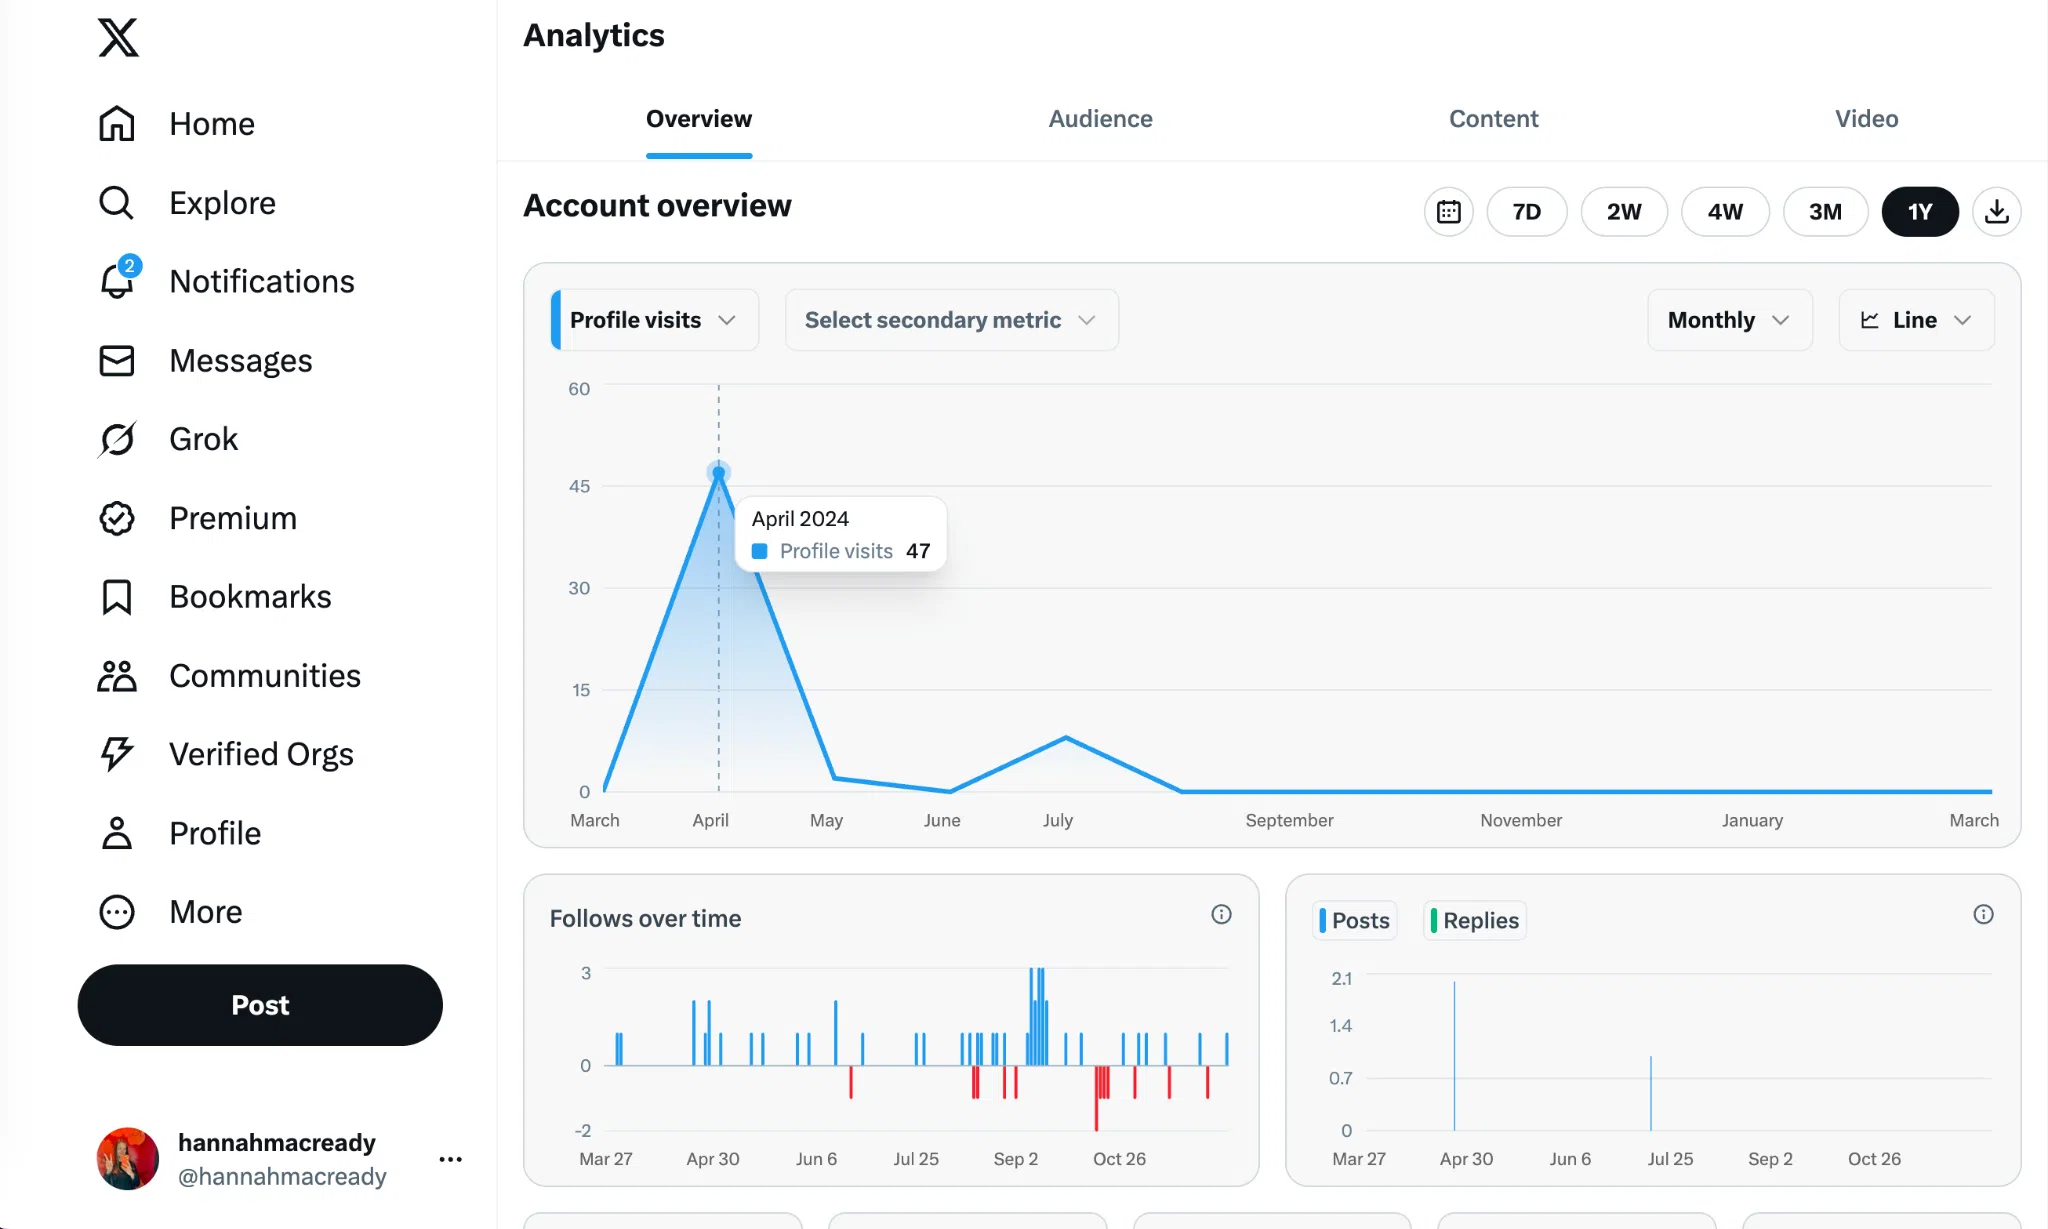
The fundamental architecture of Twitter analytics has undergone a major transition. Historically, native reporting dashboards were universally free and accessible to all registered users. Today, the full, account-level analytics dashboard is gated behind X Premium—which boasts roughly 4.4 million paid subscribers globally—or available exclusively to desktop-verified accounts.
Despite these paywalls, a hybrid model of data accessibility persists:
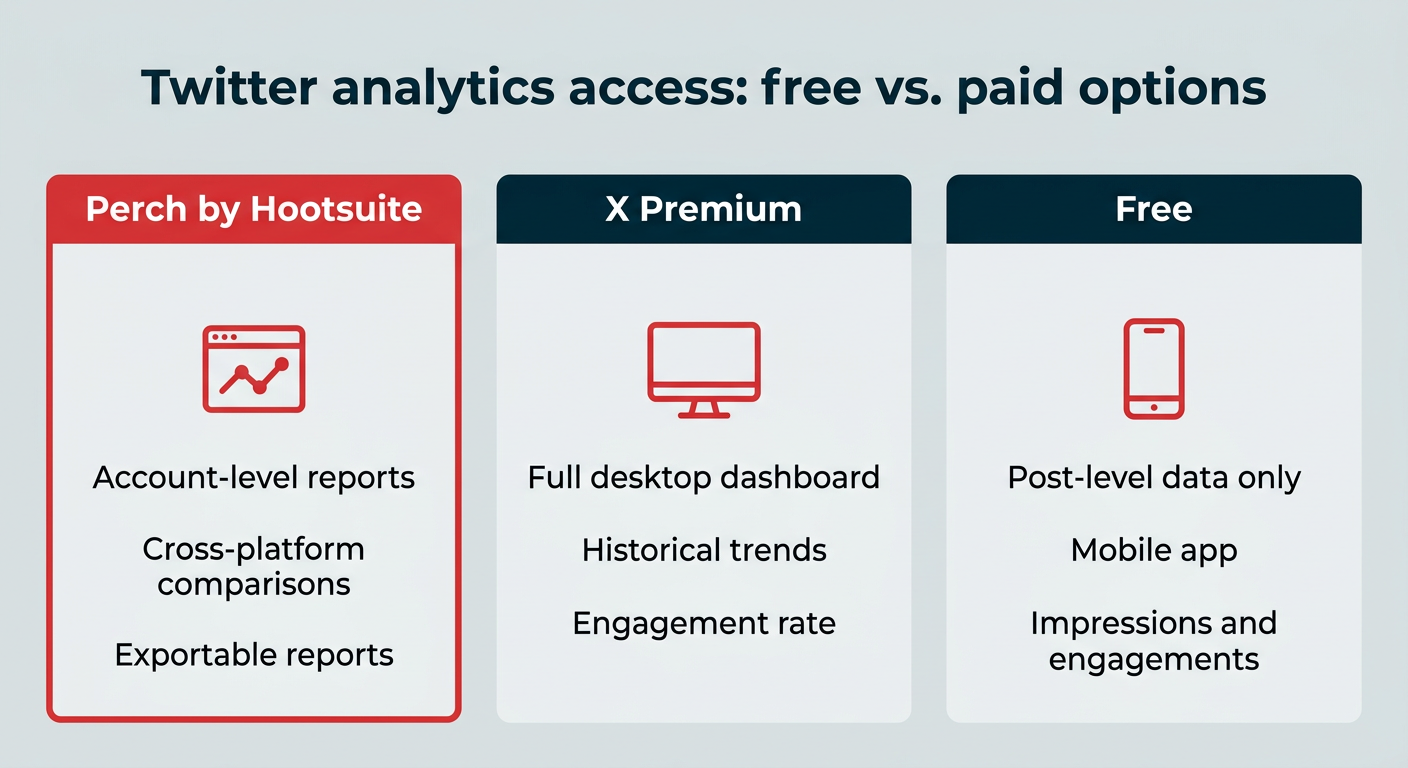
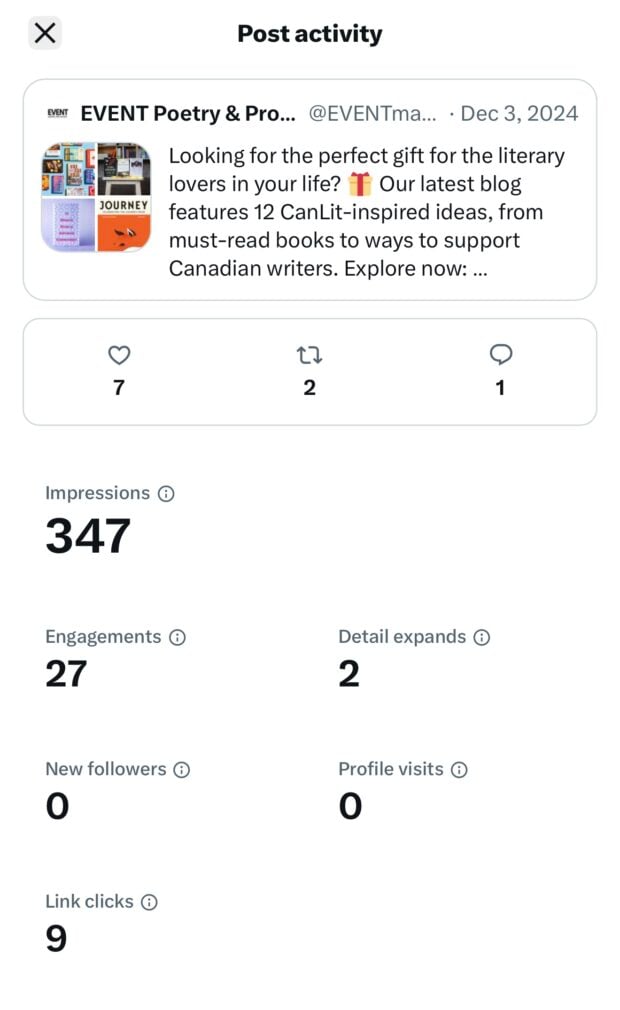
Post-Level Free Access: Users operating free accounts can still view basic post-level analytics directly through the X mobile application by navigating individual post menus.
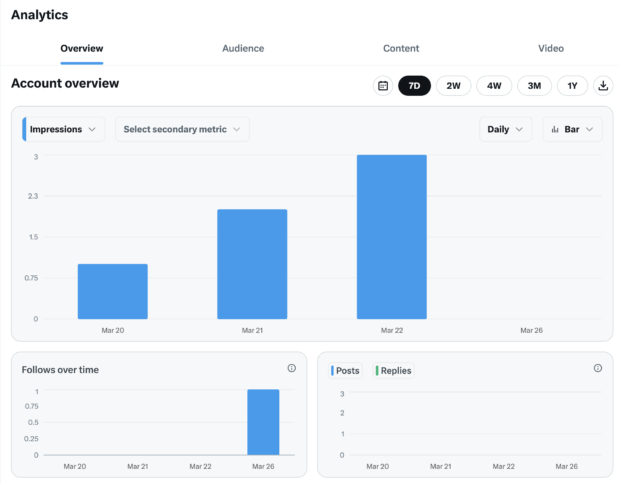
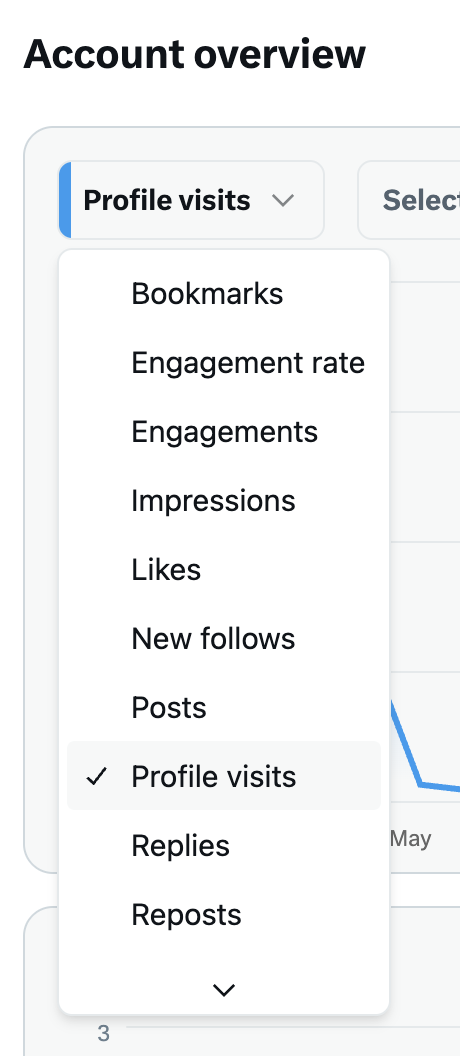
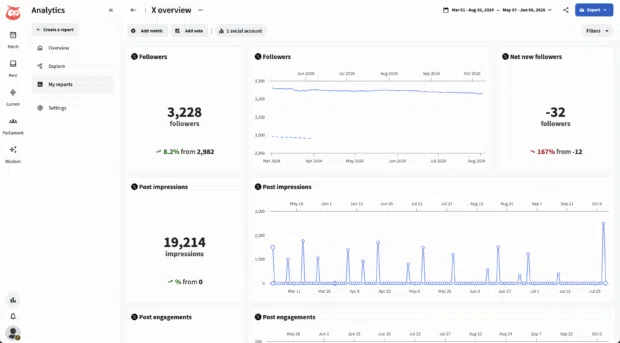
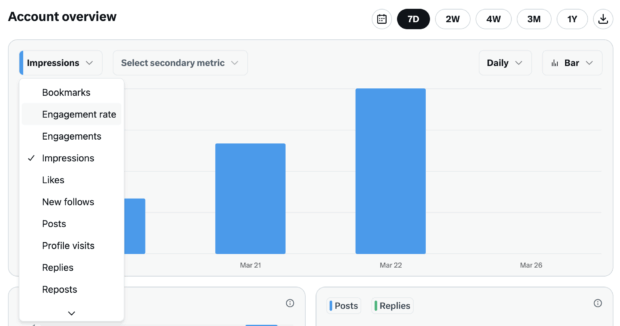
Aggregated Dashboards: Premium desktop users maintain access to holistic metrics, including long-term follower growth trends, impressions, and engagement rate visualizations.
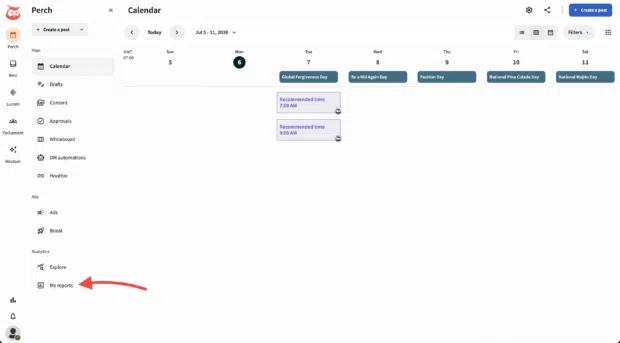
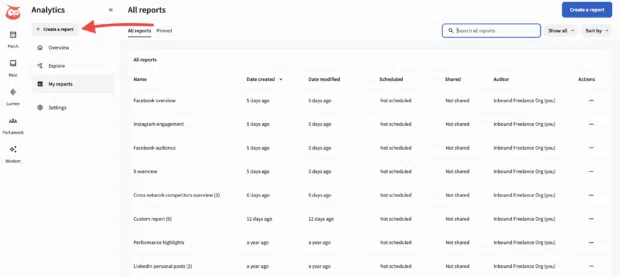
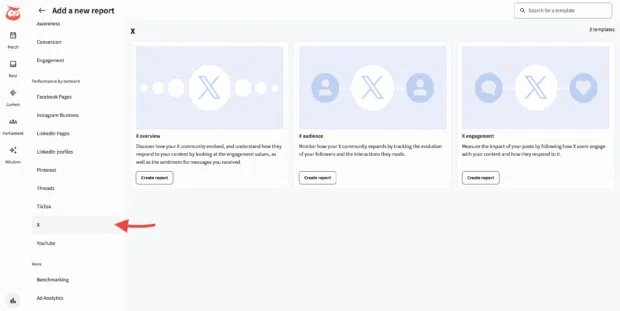
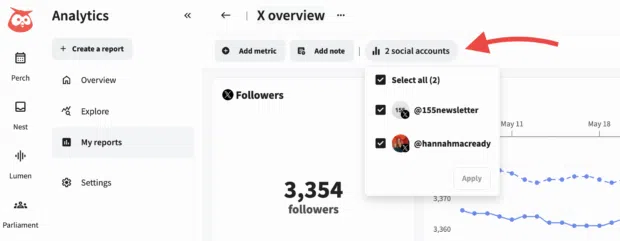
Third-Party Solutions: Enterprise-grade platforms such as Perch by Hootsuite allow organizations to circumvent single-platform restrictions, compiling cross-channel reports, tracking custom goals, and evaluating competitive landscapes in a unified dashboard.
Chronology: How X Analytics Access Evolved
To understand how marketers arrived at today’s analytics framework, it helps to review the timeline of platform changes:
The Legacy Era (Pre-2023): X (then Twitter) provided an open, robust, desktop-based analytics dashboard (analytics.twitter.com) for every user, offering comprehensive organic data, tweet-by-tweet breakdowns, and audience insights at zero cost.
The Verification & Paywall Transition (2023–2024): Following platform acquisitions and structural overhauls, the native web analytics suite was temporarily deprecated, migrated, and subsequently locked behind subscription-based tiers (X Premium) to incentivize verification and creator monetization programs.
The Creator Economy Integration (2025): X tied analytics windows tightly to its creator ad revenue-sharing initiatives. Metrics like impressions over rolling two-week pay periods became financial indicators rather than purely marketing KPIs.
The Cross-Platform Consolidation (2026): With market fragmentation growing, advanced analytics tools like Perch, Buffer, and Later adapted to provide alternative account-level reporting, automated UTM tracking, and sentiment analysis via social listening integrations.
Supporting Data: Key Metrics and Benchmarks
Data-driven strategies require clear baselines. According to recent digital marketing benchmarks, understanding how content travels on X helps marketers filter out vanity metrics and focus on performance that drives business outcomes.
Core Metrics at a Glance
Average Post Performance: Standard X posts in recent industry studies averaged roughly 33 likes and 7 reposts/retweets, though algorithmic shifts heavily prioritize dynamic engagement and video watch time.
Impression Trends: Average organic impressions per post experienced a slight downward shift (roughly 5% year-over-year), making targeted distribution, strong hooks, and video formats essential for maintaining reach.
Engagement Rate Formula: Calculated as $text(Total Engagements / Total Impressions) times 100$. Engagements encompass replies, reposts, likes, bookmarks, link clicks, and profile visits.
Goal-Based Metric Mapping
Marketing Goal
Key Metrics to Track
Strategic Value
Brand Awareness
Impressions, Reach, Profile Visits, Mentions
Measures total audience exposure and curiosity conversion.
Community Building
Replies, Reposts, New Followers
Indicates genuine resonance and algorithmic distribution potential.
Website Traffic
Link Clicks, Profile Visits
Evaluates CTA strength, copy urgency, and bottom-of-funnel intent.
Brand Perception
Sentiment, Mentions, Replies
Serves as a qualitative temperature check on brand health.
Official Responses and Industry Perspectives
Adapting to restricted native analytics requires agility from modern marketing teams. Industry experts emphasize that successful social strategies rely on combining fast, post-level feedback with long-term, macro-level trends.
Nick Martin, Social Media Marketing Manager at Tipalti, notes that isolating individual metrics without broader context can lead to misinformed strategies.
"I zoom out to see how our profile is performing on a weekly, monthly, and quarterly basis," Martin explains. "The fast feedback from individual post analytics will help me make adjustments so that I can be more successful with my posts in the future."
Martin advocates for treating underperforming posts not as failures, but as controlled experiments—testing variables such as visual assets, copy length, thread structures, and publishing times. Furthermore, he stresses the value of cross-departmental data sharing: pushing insights from social feedback into product, sales, and creative teams to inform broader organizational strategies.
Implications for Marketers and Enterprises
The restriction of native web analytics and the evolution of algorithmic content delivery carry significant implications for modern digital strategies:
1. Shift Toward Third-Party Social Suites
Because native reporting now requires paid subscriptions on X—or offers limited visibility strictly through mobile apps—enterprises and agencies increasingly rely on centralized management software. Solutions like Perch by Hootsuite allow teams to track X performance alongside LinkedIn, Instagram, and TikTok without purchasing individual platform tiers for multiple team members.
2. Prioritizing Actionable Conversion Over Vanity Metrics
With average organic impressions fluctuating, tracking surface-level likes is no longer sufficient to prove ROI to senior stakeholders. Modern reporting must connect social activity directly to downstream goals: website traffic via custom URL shorteners (such as Ow.ly), lead generation, and customer sentiment analysis via social listening tools like Lumen by Talkwalker.
3. The Rising Prominence of Video and Conversational Threads
Algorithms heavily reward watch time and active dialogue. Marketers must optimize video content with early hooks and captions for sound-off viewing, while treating replies and quote-posts as primary indicators of community health.
To turn data into a competitive advantage, social media managers should implement the following steps:
Establish Clear Baselines: Calculate your historical average engagement rate and impressions over the last 90 days. Knowing your baseline ensures you can accurately distinguish a viral anomaly from a systematic success.
Spy Smartly Through Competitive Listening: Build private lists of competitor accounts. Monitor their publishing cadence and audience reactions using social listening streams to discover untapped content formats.
Align Metrics with Business Objectives: Avoid drowning in dashboards. If your primary objective is lead generation, prioritize link clicks and conversion tracking over passive likes.
Democratize Insights: Share top-performing post analytics and customer feedback across internal departments to influence product roadmaps, sales messaging, and creative design choices.
By combining disciplined metric tracking, flexible third-party tooling like Perch, and continuous experimentation, marketers can maintain a high-performing presence on X well into the future.

 By Nila Kartika Wati




 Basiran
 Nana Muazin
 Siti Muinah
