
 By Raul Delapena Setiawan
In the fast-paced world of digital marketing, vanity metrics like follower counts and total impressions can easily create a false sense of security. A brand might boast a million followers, but if its posts are met with deafening silence, that massive audience yields little commercial value. Enter the engagement rate—the definitive yardstick for measuring whether social media audiences are genuinely listening, caring, and acting.

As social media algorithms grow increasingly sophisticated and brand competition for screen time reaches an all-time high, understanding and accurately calculating engagement rates has become non-negotiable for enterprise teams, independent creators, and marketers alike. This comprehensive guide breaks down the science of social media engagement, explores the six primary formulas used to calculate it, and analyzes industry benchmarks to help marketers refine their strategies.

What is an Engagement Rate and Why Does It Matter?
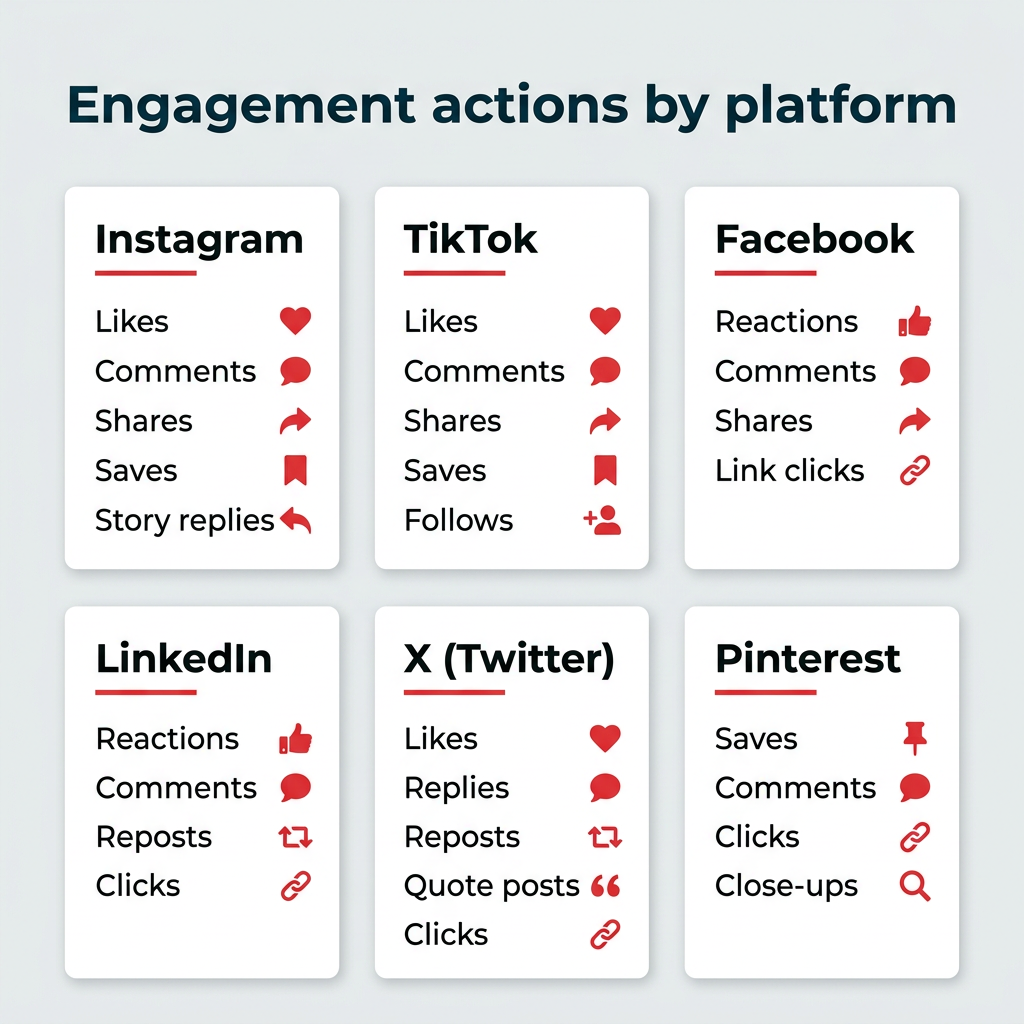
At its core, an engagement rate is a social media metric that evaluates the level of active interaction a piece of content, a campaign, or an entire account receives relative to its reach or audience size. While definitions vary slightly by platform, engagement generally encompasses any intentional action a user takes to interact with content. These actions include likes, comments, shares, saves, poll responses, direct messages, and outbound link clicks.
Engagement metrics matter for three fundamental reasons:
- Audience Connection: When a user takes the time to comment on, share, or save a post, it serves as a robust signal that the content has successfully delivered value, sparked emotion, or inspired action.
- Algorithm Visibility: Modern social media algorithms prioritize content that generates immediate user interaction. High engagement rates signal to platforms like Instagram, TikTok, and LinkedIn that a post deserves to be surfaced to wider, untapped audiences.
- Proving ROI: For enterprise teams and corporate leadership, engagement rates bridge the gap between creative content and real-world audience behavior, serving as one of the clearest indicators of return on investment (ROI).
The Six Core Engagement Rate Formulas
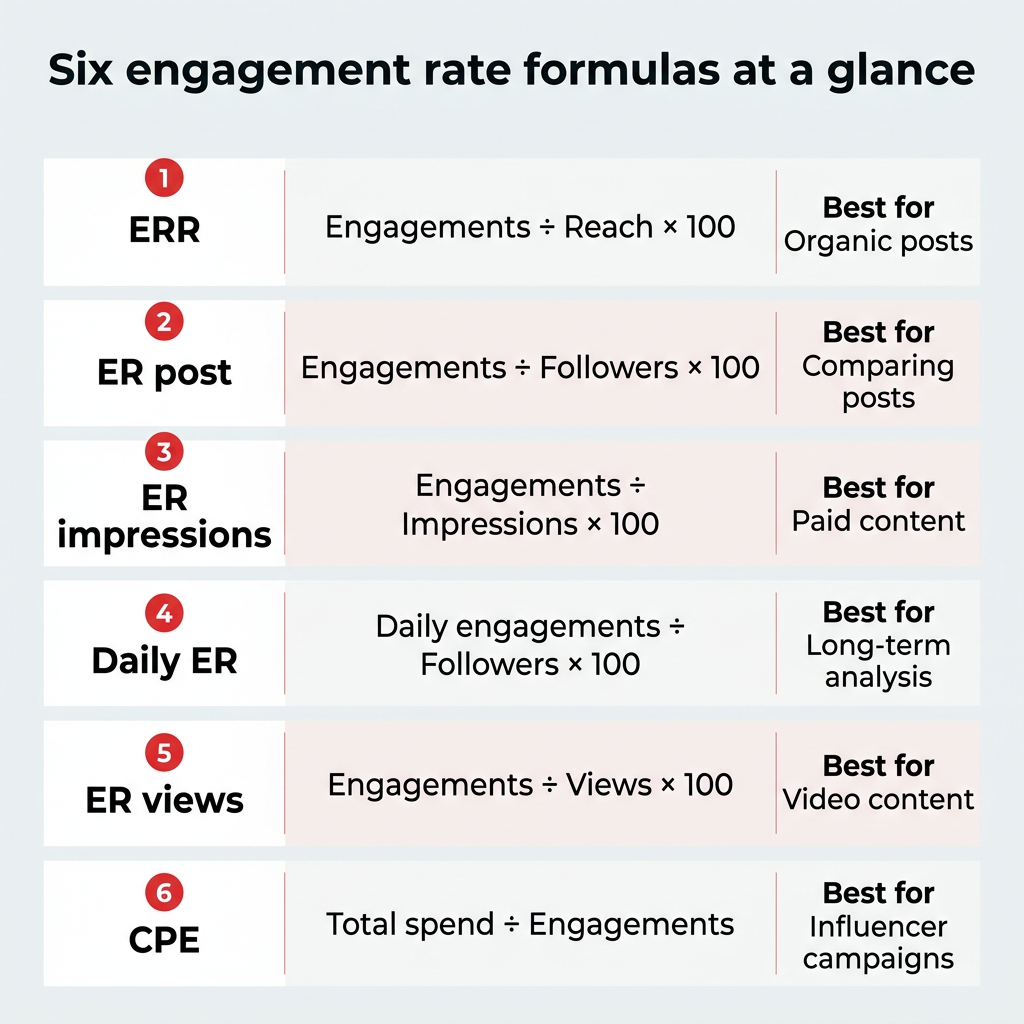
Because different analytical questions require different analytical lenses, there is no single "universal" engagement rate formula. Instead, marketers rely on six distinct variations, each utilizing a unique denominator.
1. Engagement Rate by Reach (ERR) — The Organic Standard
ERR measures the percentage of unique individuals who chose to interact with a piece of content after seeing it.
- Formula: $(textTotal Engagements on a Post div textReach of that Post) times 100$
- Pros: Because algorithm-driven feeds mean not all followers see every post, ERR provides a highly accurate reflection of performance among actual viewers.
- Cons: Reach can fluctuate wildly due to algorithmic shifts, occasionally skewing results if a post achieves exceptionally low or high distribution.
2. Engagement Rate by Post (ER Post) — The Creator Benchmark
Popularized by social media influencers, this metric compares total engagements against an account’s total follower count.

- Formula: $(textTotal Engagements on a Post div textTotal Followers) times 100$
- Pros: Offers a stable baseline for comparing individual posts against one another, neutralizing fluctuating reach metrics.
- Cons: Ignores viral reach originating outside the follower base. Furthermore, as an account grows its follower count organically, this metric naturally trends downward.
3. Engagement Rate by Impressions (ER Impressions) — The Paid Media Metric
This formula measures engagements against the total number of times content appears on a screen, accounting for repeat views by the same user.
- Formula: $(textTotal Engagements on a Post ÷ textTotal Impressions) times 100$
- Pros: Ideal for evaluating paid advertising campaigns, particularly when utilizing Cost-Per-Thousand (CPM) pricing structures.
- Cons: Yields lower percentage rates than reach- or follower-based formulas, as users rarely engage with the same ad every single time they view it.
4. Daily Engagement Rate (Daily ER) — The Long-Term View
Daily ER tracks how frequently followers interact with an account across an average day, factoring in historic content as well as newly published posts.

- Formula: $(textTotal Engagements in a Day div textTotal Followers) times 100$
- Pros: Captures residual engagement on older content (e.g., a new follower browsing and liking past posts).
- Cons: Cannot differentiate between a single hyper-active follower engaging ten times versus ten unique followers engaging once.
5. Engagement Rate by Views (ER Views) — The Video Specialization
Tailored for video-centric formats like Instagram Reels or TikToks, this metric compares total video interactions against total views.
- Formula: $(textTotal Engagements on Video Post div textTotal Video Views) times 100$
- Pros: Provides an accurate performance read specifically for video-first content objectives.
- Cons: View counts frequently include repeat views from the same user, which can depress the resulting percentage rate.
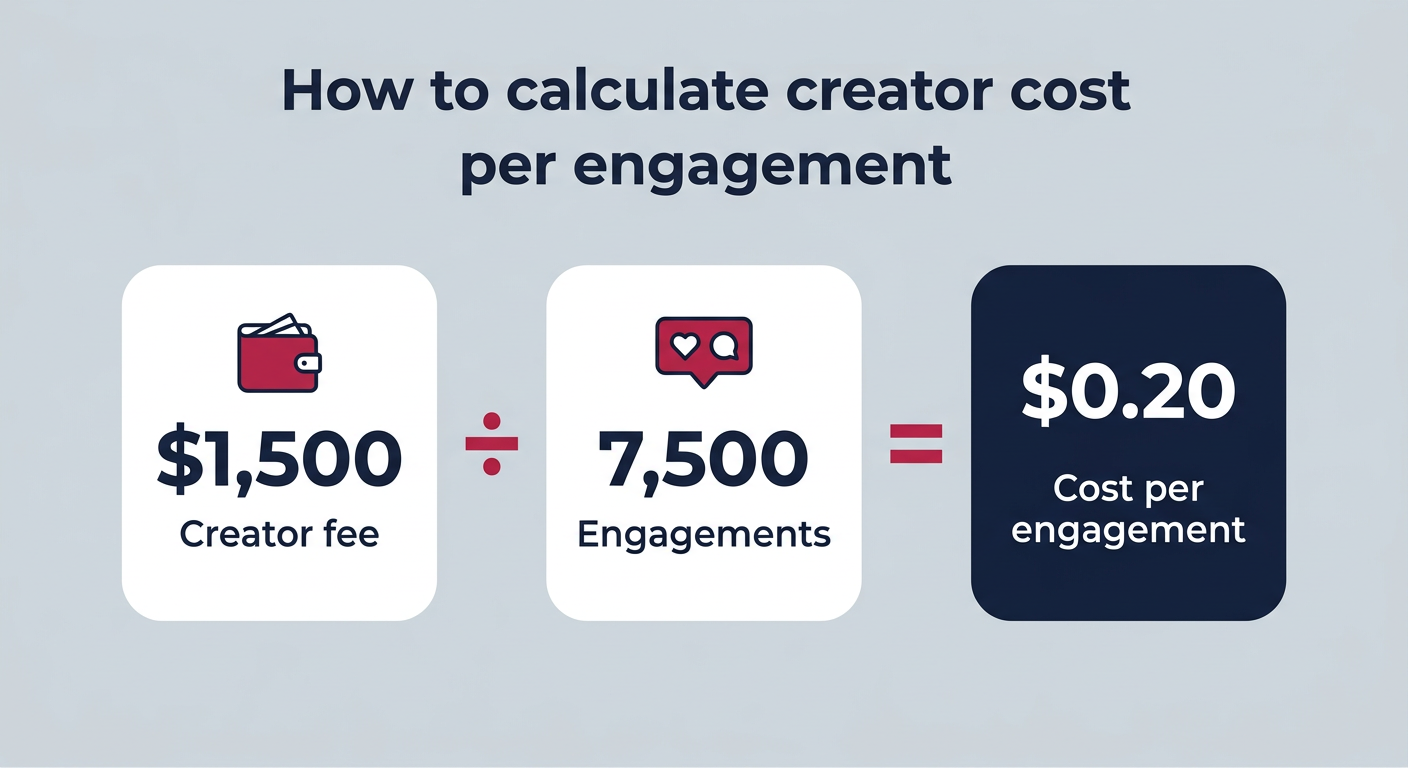
6. Cost per Engagement (CPE) — The Financial Efficiency Gauge
CPE evaluates financial efficiency by dividing total campaign spend by total generated interactions.
- Formula: $textTotal Amount Spent div textTotal Engagements$
- Pros: Essential for comparing creator partnerships and influencer marketing campaigns on an equal financial playing field.
Platform-Specific Nuances: Instagram, TikTok, and YouTube
While mathematical formulas remain consistent, platform analytics differ significantly in what they count and display.
- Instagram: Feed posts and carousels are best measured using ERR (likes, comments, shares, saves divided by reach). Reels require ER Views due to platform reporting structures, while Stories rely on replies, sticker taps, and link clicks relative to Story reach.
- TikTok: ER Views serves as the standard methodology on TikTok (interactions divided by total video views). Marketers should note that native TikTok dashboards do not always factor saves or profile follows into baseline engagement metrics.
- YouTube: Because YouTube Studio does not feature an out-of-the-box engagement rate, creators must calculate it manually by dividing likes, comments, and shares by total views. However, platform experts emphasize that watch time and audience retention remain far superior ranking signals.
Industry Benchmarks: What Constitutes a "Good" Engagement Rate?
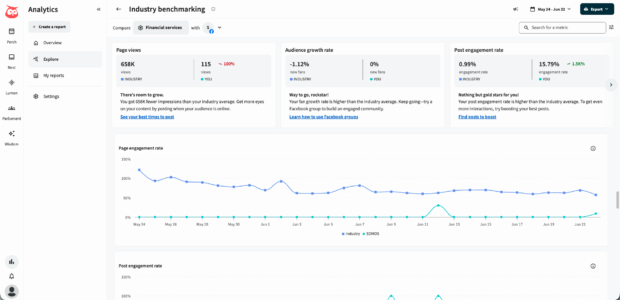
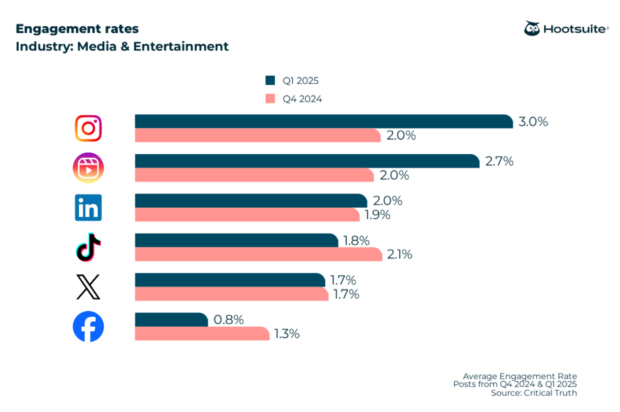
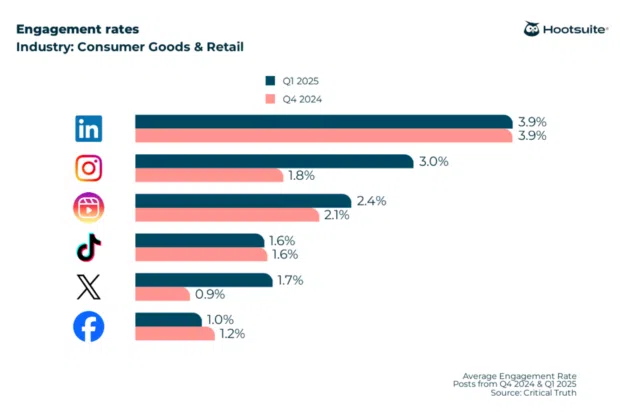
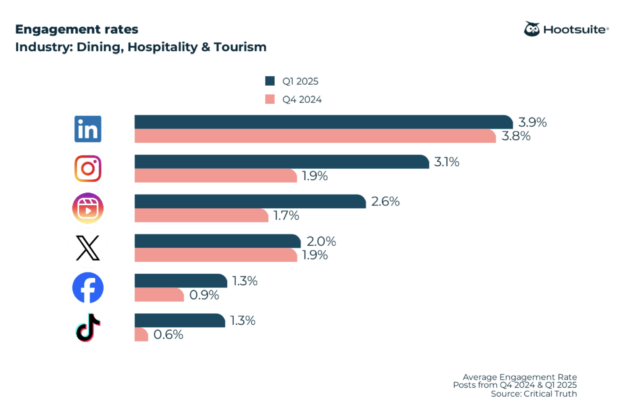
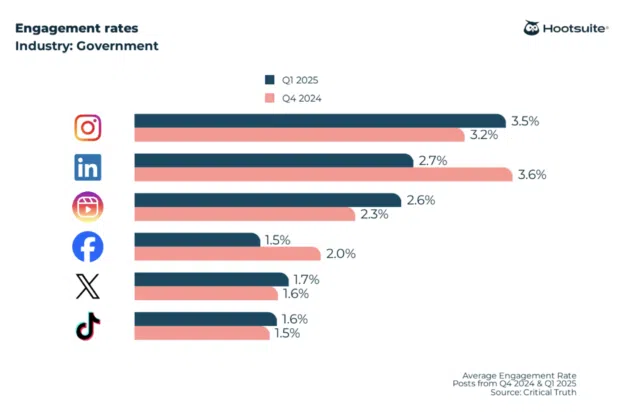
Across the digital marketing landscape, a healthy engagement rate generally hovers between 1% and 5%. However, performance expectations vary heavily by industry and platform. According to recent social media benchmark data, all-industry platform averages for best-performing content types stand as follows:
- Instagram: 4.2% (driven primarily by multi-image Carousels)
- LinkedIn: 3.9% (led by native video content)
- Facebook: 2.9% (led by photo Albums)
- X (formerly Twitter): 1.8% (status updates)
- TikTok: 1.5% (video content)
Sector-Specific Insights
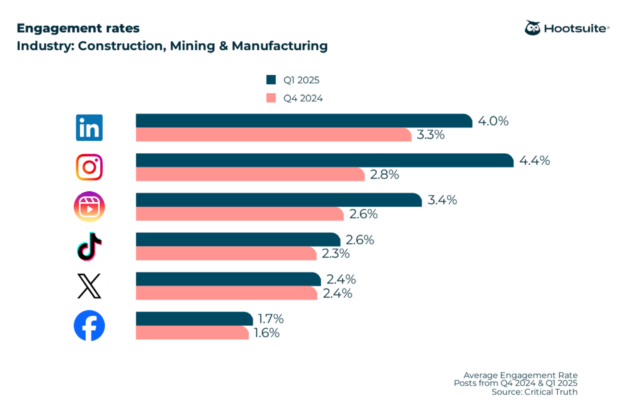
- Construction & Manufacturing: Dominate LinkedIn due to robust B2B networking, while Instagram leads consumer-facing metrics in this sector at 5.2%.
- Nonprofits: Boast the highest organic Instagram engagement rates in the industry, hitting 5.5% as mission-driven content naturally inspires shares and emotional resonance.
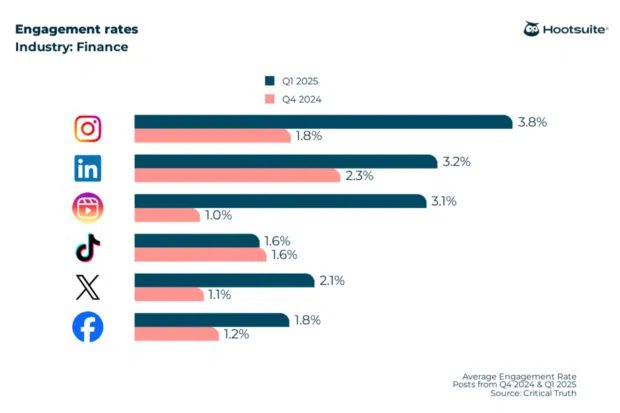
- Healthcare & Finance: Heavily regulated compliance review processes often result in lower publishing volumes, which paradoxically helps per-post engagement rates remain strong (hovering near 4.1% on Instagram for financial services).
Strategic Implications and How to Improve
Engagement rate data should never exist in an isolated monthly report. Instead, marketers must use engagement trends as actionable intelligence to shape future content planning.
To systematically improve engagement rates over time, digital strategists recommend:
- Audience Timing Analysis: Publishing content precisely when core target demographics are most active online.
- Format Diversification: Leaning heavily into algorithm-favored formats such as interactive polls, short-form video, and swipeable carousels.
- Proactive Community Management: Responding promptly to comments within the critical "golden hour" after publication to kickstart organic algorithmic distribution.
- Data-Driven Iteration: Regularly auditing top-performing posts to identify repeating patterns in tone, visual style, or messaging.
By treating engagement rate as an interactive diagnostic tool rather than a static grade, brands can transform their social media channels from broadcast megaphones into thriving, community-driven ecosystems.
 Azzam Bilal Chamdy
  Iffa Jayyana
  Evan Lee Salim