
 By Siti Muinah
In the hyper-competitive landscape of digital marketing, superficial metrics like follower counts and total impressions are rapidly losing their luster. For modern brands, digital agencies, and enterprise marketing teams, the true north star of social media performance is the engagement rate.

Far more than just a vanity metric, engagement rate measures the active heartbeat of an audience—turning passive scrollers into participating community members. Whether proving return on investment (ROI) to executive leadership or fine-tuning an organic content calendar, understanding how to calculate, interpret, and optimize engagement is vital for digital survival.

Main Facts: What is Engagement Rate and Why Does It Matter?
At its core, engagement rate is a social media metric that calculates how actively an audience interacts with content relative to a specific baseline, such as total reach, impressions, views, or follower count.
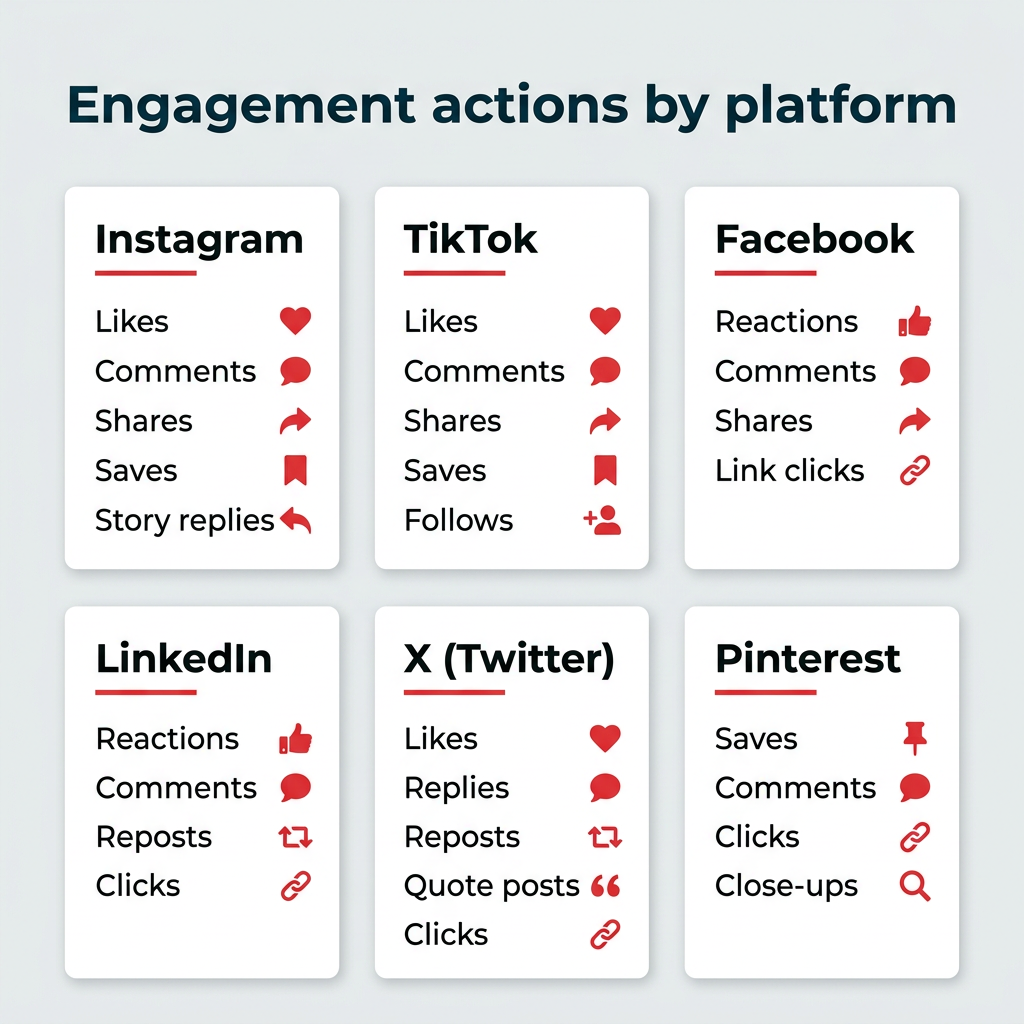
While definitions vary slightly by platform, "engagement" generally encompasses any active step a user takes to interact with a post. This includes likes, comments, shares, saves, poll responses, direct messages, and link clicks. Passive viewing metrics—such as impressions and video views—are strictly excluded, as they measure exposure rather than active participation.
Why Engagement Rate Matters
- Audience Connection: High engagement signals that content is genuinely resonating, providing utility, or sparking emotion.
- Algorithmic Favorability: Social media algorithms are designed to keep users on platforms longer. By surfacing content that naturally drives interactions, algorithms automatically propel high-engagement posts toward wider, unreached audiences.
- Brand Trust and Credibility: First-time profile visitors are far more likely to trust a brand that boasts an active community conversing in the comments section.
- Proving ROI: For enterprise teams, engagement rates provide concrete data tying social media content performance directly to real consumer behavior and brand value.
Chronology: The Evolution of Social Metrics to Engagement-First Strategies
To understand the current obsession with engagement rates, it helps to examine how social media measurement has evolved over the past two decades:
- The Early Era (Mid-2000s): Social media metrics were heavily focused on vanity numbers—primarily follower growth and raw email opt-ins. Brands simply wanted to occupy digital space.
- The Impression Boom (2010s): As algorithms took over chronological feeds, platforms introduced impressions and reach. Marketers shifted toward maximizing visibility through sheer volume.
- The Algorithm Shift & Quality Focus (Late 2010s–2020s): Platforms began deprioritizing chronological feeds in favor of recommendation engines driven by user behavior. Saves, shares, and comments became the golden tickets for distribution.
- The Modern Era (Present Day): With influencer marketing spending surpassing $10 billion and corporate budgets facing tighter scrutiny, brands have abandoned vanity metrics entirely. Today, sophisticated formulas like Cost Per Engagement (CPE) and Engagement Rate by Reach (ERR) dictate campaign success.
Supporting Data: The Six Essential Engagement Rate Formulas
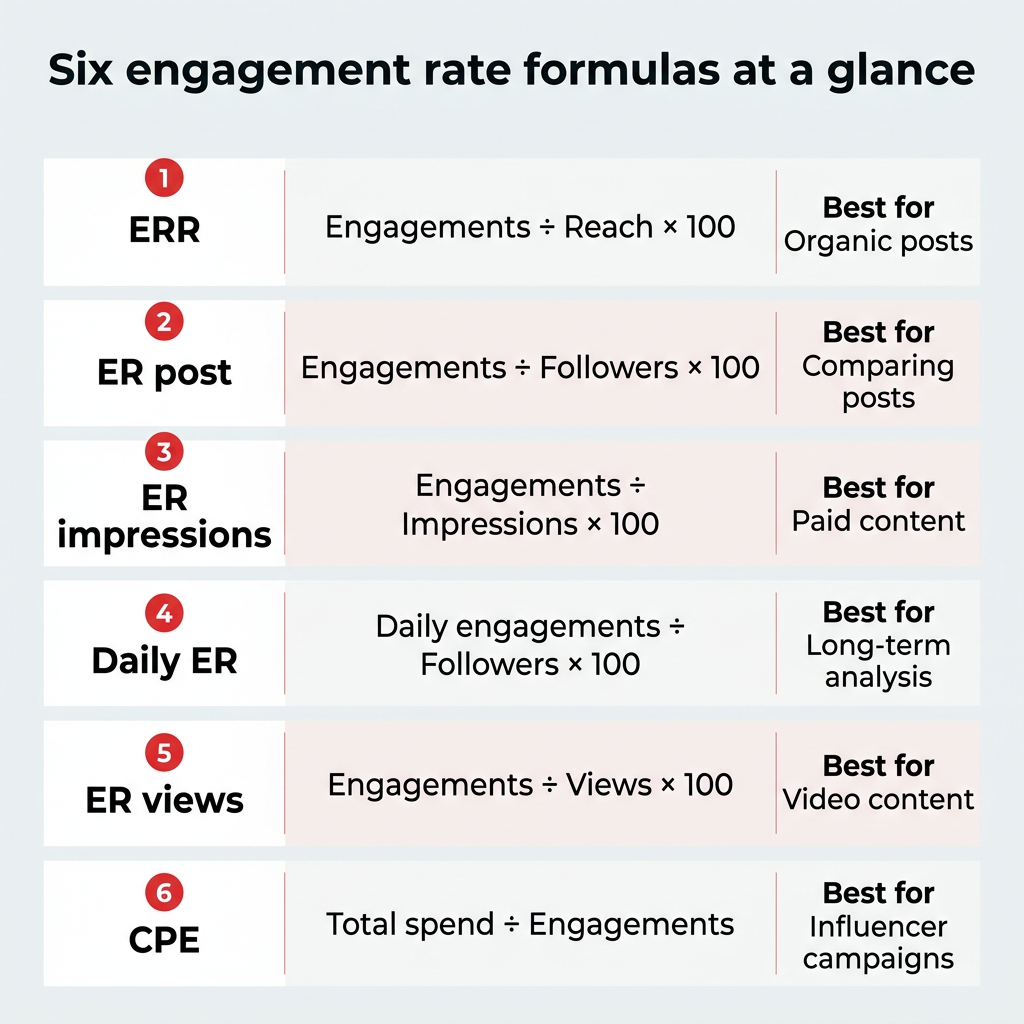
Because different channels and campaigns serve different purposes, there is no single "one-size-fits-all" equation for engagement. Marketers rely on six distinct formulas, each utilizing a unique denominator to answer a specific strategic question.
1. Engagement Rate by Reach (ERR) — Most Common
ERR measures the percentage of people who interacted with a post after actually seeing it.

- Formula: $(textTotal Engagements on a Post div textReach of that Post) times 100$
- Pros: Highly accurate in algorithm-driven feeds where followers may not see every post. Includes non-followers who discover content via search or shares.
- Cons: Reach fluctuates unpredictably, meaning artificially low reach can skew the percentage upward.
2. Engagement Rate by Post (ER Post) — Best for Specific Posts
This metric compares post interactions against your total follower count, serving as a reliable benchmark for individual performance (commonly used by influencers).
- Formula: $(textTotal Engagements on a Post div textTotal Followers) times 100$
- Pros: Provides a stable baseline when reach fluctuates.
- Cons: Ignores viral reach outside your follower base. As follower counts grow, this rate naturally tends to decline.
3. Engagement Rate by Impressions (ER Impressions) — Best for Paid Content
Measures engagements against the total number of times content is displayed on a screen (including multiple views by the same user).

- Formula: $(textTotal Engagements on a Post div textTotal Impressions) times 100$
- Pros: Exceptionally effective for evaluating paid social advertising and CPM (cost-per-thousand impressions) models.
- Cons: Yields lower percentages than other formulas because users rarely engage every single time they see an ad.
4. Daily Engagement Rate (Daily ER) — Best for Long-Term Analysis
Measures how often followers interact with an account on an average day across all historical and active posts.
- Formula: $(textTotal Engagements in a Day div textTotal Followers) times 100$
- Pros: Captures engagement on legacy content (e.g., a new follower liking older posts).
- Cons: Cannot distinguish between a single hyper-active follower and many casual followers interacting once.
5. Engagement Rate by Views (ER Views) — Best for Video Content
Measures video engagement relative to total video views (essential for Reels, TikToks, and YouTube Shorts).
- Formula: $(textTotal Engagements on Video div textTotal Video Views) times 100$
- Pros: Tracks video performance directly against video consumption.
- Cons: Repeat views from the same user can artificially deflate the percentage.
6. Cost Per Engagement (CPE) — Best for Influencer & Paid Campaigns
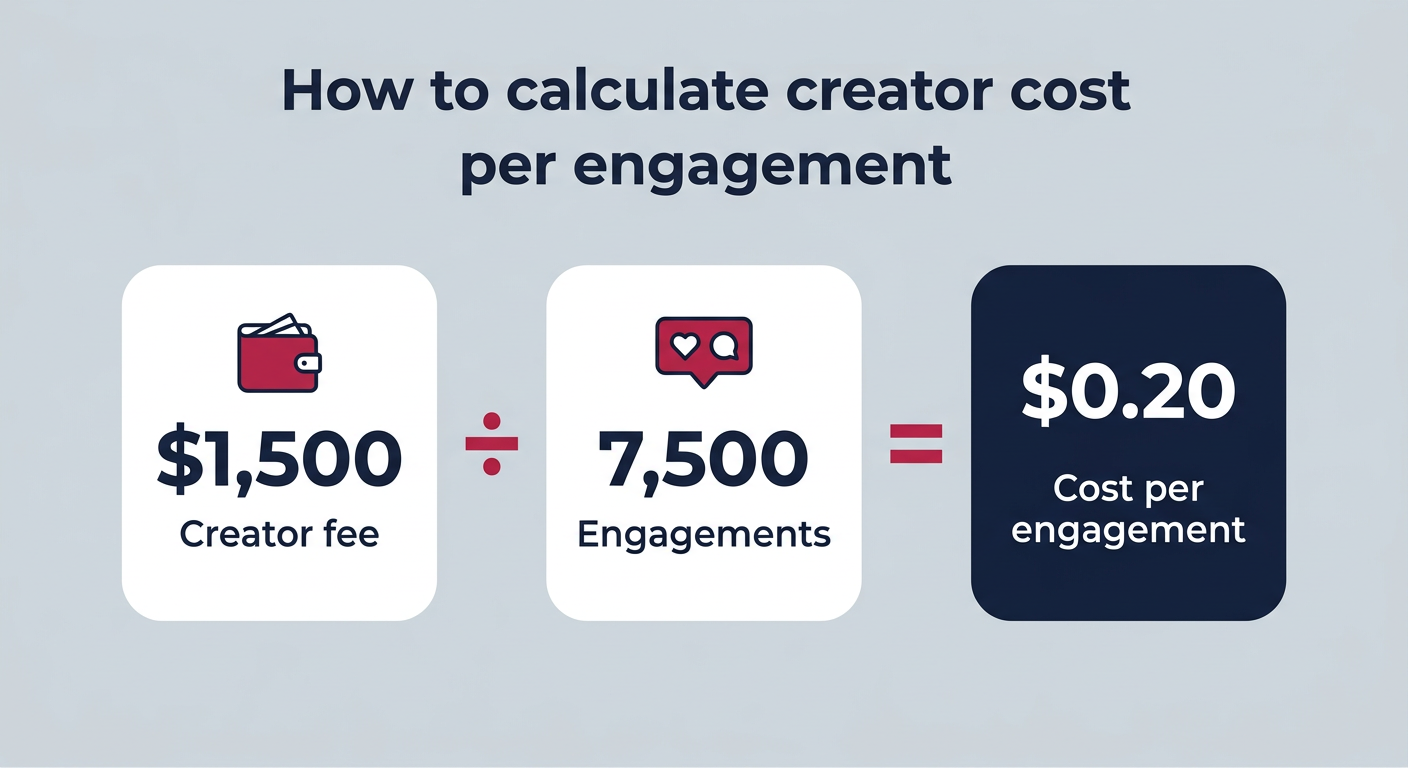
Calculates the exact financial cost required to generate a single user interaction.
- Formula: $textTotal Amount Spent div textTotal Engagements$
- Pros: The ultimate tool for determining the cost-efficiency of creator partnerships and paid ad spend.
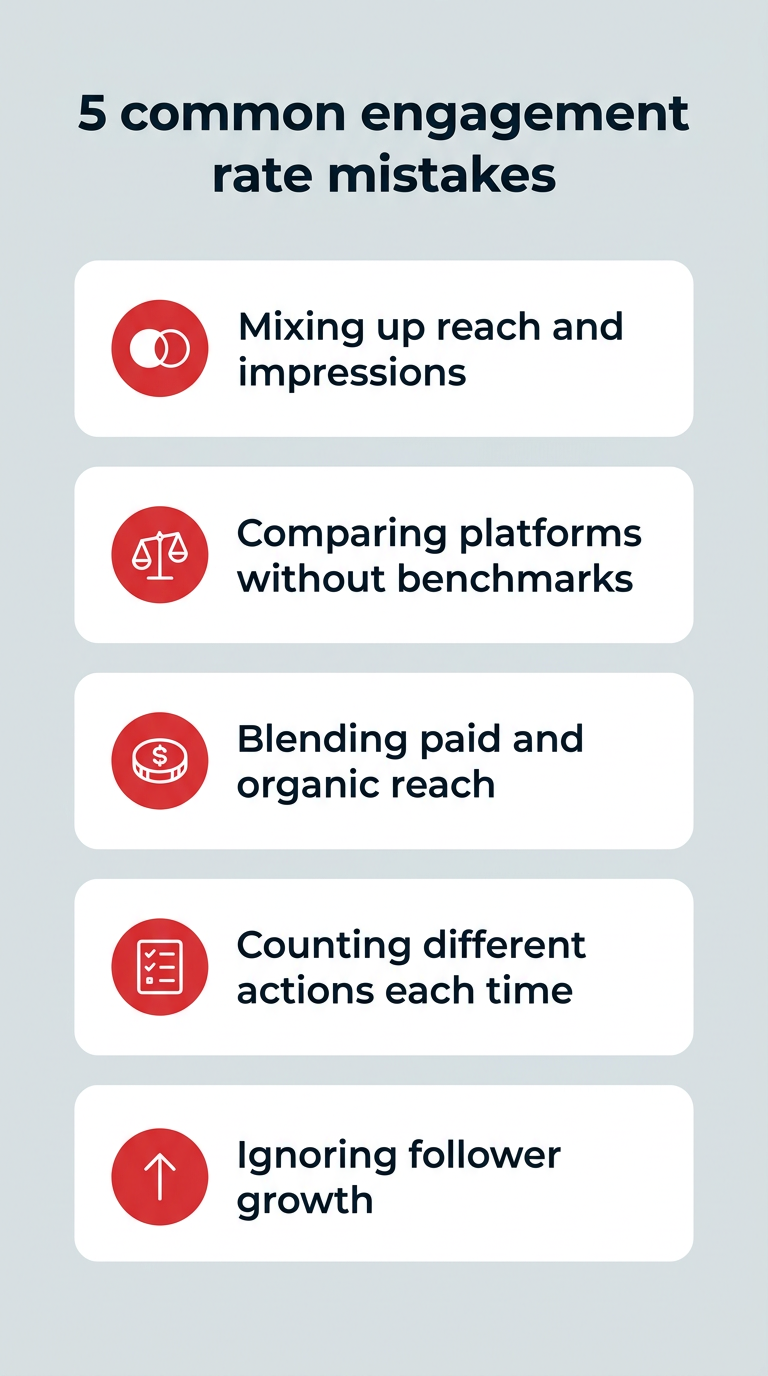
- Cons: Requires strict consistency in defining what constitutes an "engagement."
Official Benchmarks: What is a Good Engagement Rate in 2026?
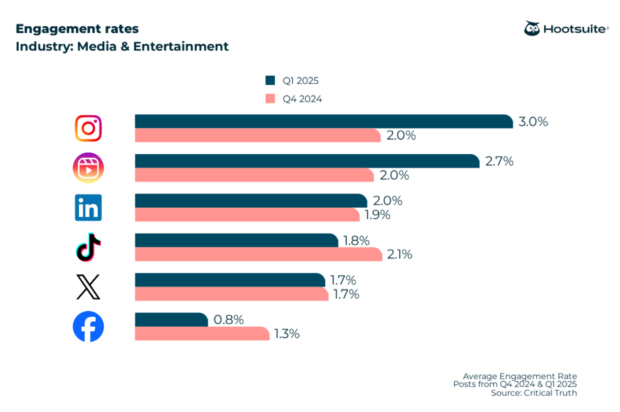
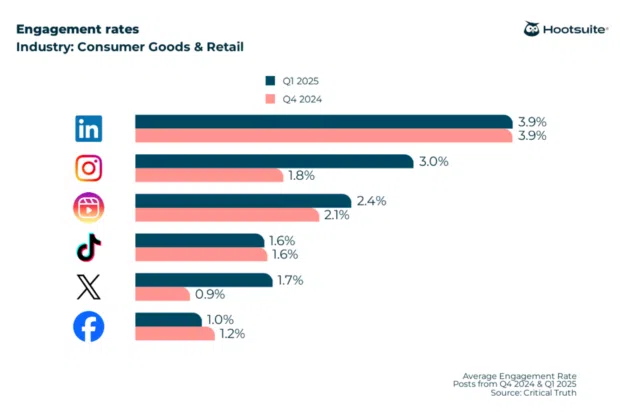
A "good" engagement rate generally hovers between 1% and 5%, though the baseline shifts dramatically depending on the industry, platform, and content format. According to recent cross-industry social media data, top-performing formats per platform average out as follows:
- Instagram: 4.2% (Best format: Carousels)
- LinkedIn: 3.9% (Best format: Videos)
- Facebook: 2.9% (Best format: Photo Albums)
- X (formerly Twitter): 1.8% (Best format: Status Updates)
- TikTok: 1.5% (Best format: Videos)
Industry Breakdown
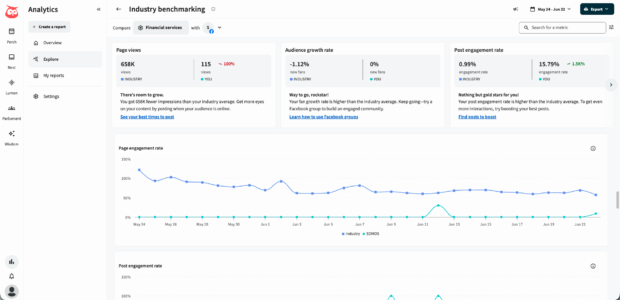
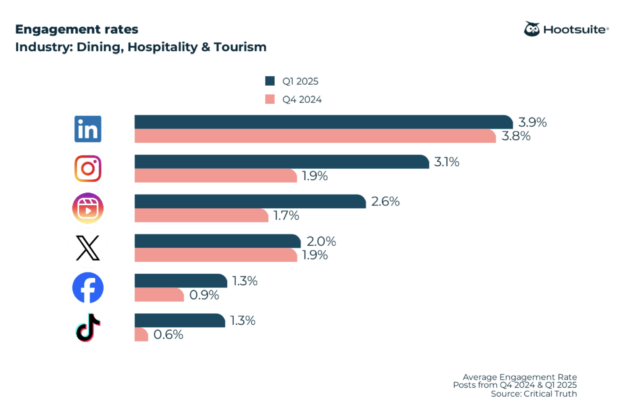
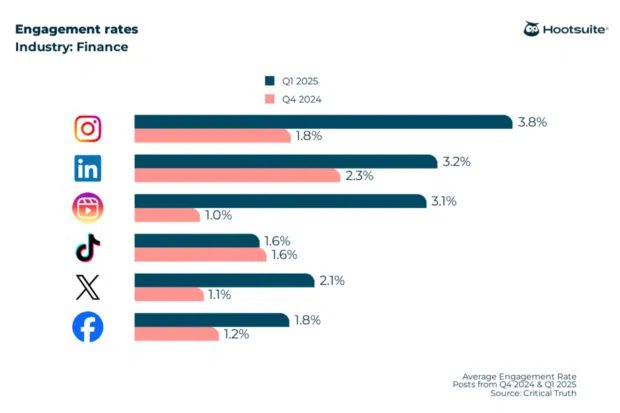
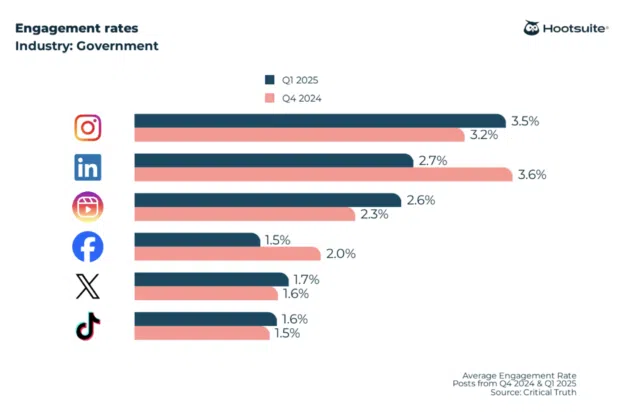
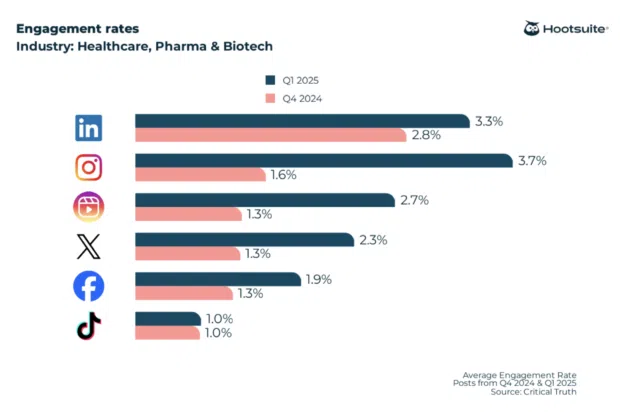
- Nonprofits: Lead the pack on Instagram with an impressive 5.5% engagement rate, heavily driven by mission-driven sharing.
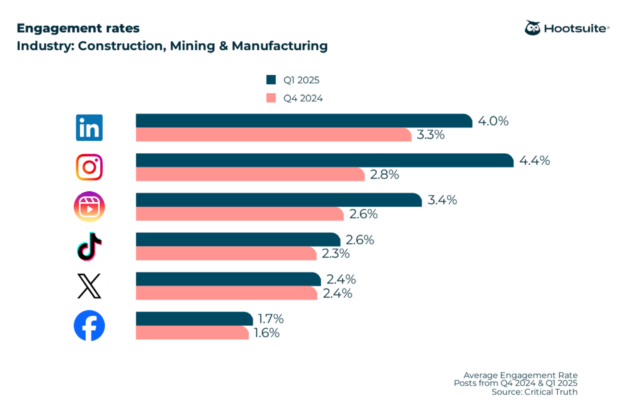
- Construction, Mining & Manufacturing: Dominate LinkedIn due to tightly targeted B2B buyers and industry peers actively networking.
- Finance: Outperforms expectations on Instagram at 4.1%, benefiting from high-consideration content subject to rigorous compliance reviews.
- Healthcare & Pharma: Face hurdles on fast-paced platforms like TikTok (hovering around 1%) due to strict regulatory and patient privacy constraints.
Implications: How to Improve Engagement and Inform Strategy
Mastering engagement rate calculations is only half the battle; the real value lies in how organizations apply these insights.
Strategic Action Plan for Marketers:
- Audit Content Formats: Use automated analytics dashboards (such as Hootsuite Analytics) to identify which content formats consistently drive the highest interaction rates—whether that means doubling down on Instagram carousels or producing more short-form B2B videos on LinkedIn.
- Optimize Timing: Publish content when audience activity peaks, ensuring maximum initial reach to feed algorithmic momentum.
- Foster Two-Way Dialogue: Promptly respond to comments and cultivate community spaces rather than treating social channels purely as broadcast mediums.
- Refine Influencer Partnerships: Prioritize micro-influencers whose high Cost Per Engagement (CPE) efficiency often outperforms mega-celebrities with bloated, inactive follower lists.
Frequently Asked Questions (FAQ)
What is a good engagement rate on social media?
A good engagement rate typically falls between 1% and 5%. However, this varies widely based on platform dynamics and industry verticals. Always compare your numbers against relevant industry benchmarks rather than generic standards.
Should I calculate engagement rate by reach or by followers?
Use engagement rate by reach (ERR) for organic content to accurately measure how content performs with people who actually see it. Use follower-based calculations when you need a stable baseline to compare individual posts over time.
How do I calculate engagement rate in Excel?
Divide the cell containing your total engagements by the cell containing your reach or follower count, then multiply the result by 100. For example: =(A2/B2)*100.
 Ali Ikhwan
  Jia Lissa